At some point, I hope to create a Notes section on my website that will turn Markdown files into a list of notes. This is basically how the blog works. But, I'm kind of busy. And since Gatsby seems like it's dead, I'm not sure that I want to invest a whole lot of time into it. (Although putting the notes in markdown seems like a good idea for compatibility.)
Anyway, here is my first very short note on Profiling.
SpeedScope
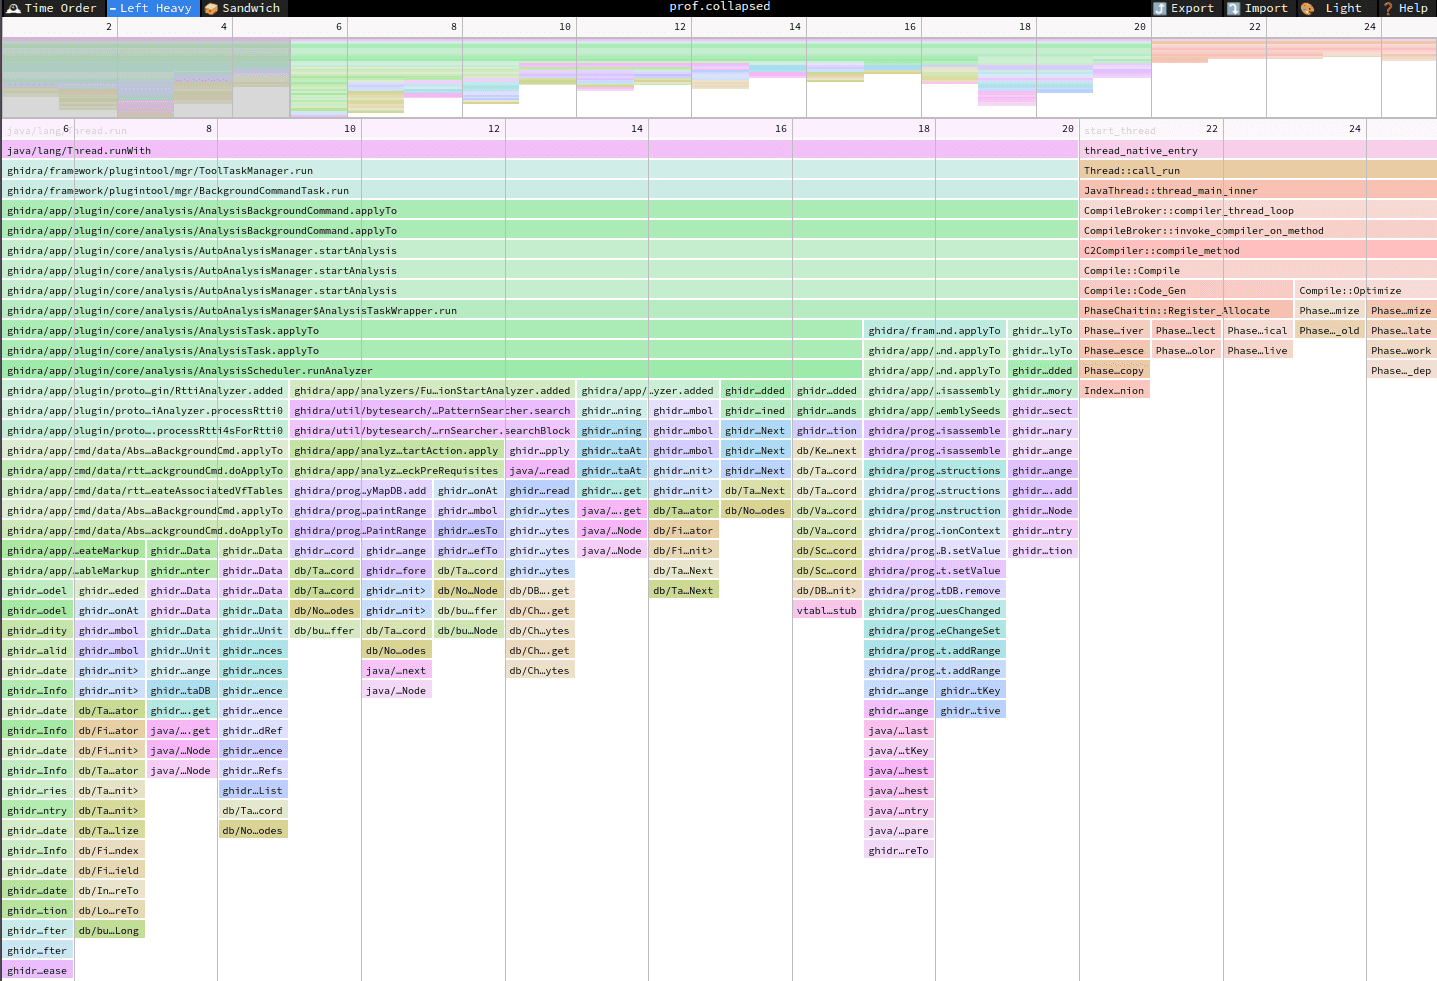
SpeedScope is an awesome tool for visualizing profiler output. It has a flame graph view that is wonderful. I also like to use the Sandwich view, sorting by total time and simply looking for the first function that I recognize. This is often the culprit.
The documentation is pretty good.
It also shows how to record profiles in compatible formats for most platforms.
I mostly use py-spy and perf.
Java
The one notably missing platform is Java! Luckily, it's not too hard to convert Java's async-profiler output to a format that SpeedScope can read. Here's how I do it:
- Download async-profiler
- Create an output file in
collapsedformat - You can do this in several ways, such as:
./asprof start -i 1s Ghidrafollowed by./asprof stop -o collapsed -f /tmp/out.prof.collapsed Ghidra./asprof collect -d 60 -o collapsed -f /tmp/out.prof.collapsed Ghidra- Then open
out.prof.collapsedin SpeedScope.
The collapsed format takes a while to parse, so it might be worth it to export the native SpeedScope format.
Powered with by Gatsby 5.0
