
I was playing around with ChatGPT and it came up with this gem:
In the thrilling world of ones and zeros, where the mere thought of assembly code sends shivers down the spines of mere mortals, there exists a unique breed of masochists—reverse engineers. Are you the kind of person who looks at a complex problem and thinks, "Why not make it harder?" If the idea of disassembling convoluted code into something even remotely understandable without any upfront instructions sounds like a fun Tuesday afternoon, then we have the perfect job for you.
Introducing the glamorous world of reverse engineering, where the nightmares of dealing with assembly code, hexadecimal hellscapes, and cryptic comments—or the lack thereof—don't just haunt you in your sleep; they're your 9 to 5. Ever wanted to spend hours, nay, days, unraveling the mysteries of code that was never meant to be understood, like an archeologist deciphering the Rosetta Stone, except what you're translating doesn't want to be translated? Congratulations, your masochistic tendencies can finally pay off.
In this role, you will dive headfirst into the abyss of other people's code, armed with nothing but your wits and perhaps an unhealthy dose of caffeine. You'll experience the unparalleled joy of finally understanding a function's purpose at 3 AM, only to realize it was a decoy. But fear not, for the fruits of your labor are many—aside from the occasional existential crisis. You'll gain the satisfaction of knowing you're outsmarting attempts to keep you out, one painstaking line at a time.
So, if you're someone who relishes the thought of your brain being tied into knots by assembly language, who finds the idea of decrypting software protections better than a crossword puzzle on a Sunday morning, and who sees a "No Trespassing" sign as a personal invitation, then the lucrative world of reverse engineering awaits. Where else can you get paid for indulging in your penchant for digital masochism? Join us, and turn your nightmares into your day job.
Ready to sign up? 🤣
I saw a quote in a recent ACM article that resonated with me:
Security must be a business enabler, not a hinderer.
The article is about product development, but the quote is applicable to IT security as well. Too often, IT departments forget what their purpose is, which is to support the mission of the organization. Security is a means to that end, not an end in itself. The goal of IT security is not to eliminate risk. The most secure computer is one that is not plugged in, but that doesn't really help us, does it? The goal of IT security is to manage risk so that the organization can achieve its mission. Unfortunately, it's significantly easier to just say "No, you can't do that because it would increase our risk" instead of "Let me fully understand why you need or want to do that, have a discussion about the security risks that will impose, and collaboratively make a decision that balances the risks and rewards for the organization."
I'm not saying that we should be cavalier about security. After all, I'm personally passionate about security. But we should be intentional about how and where we apply security when it impacts the mission, which is almost always!
I suspect a lot of people would be surprised at the (relatively low) level of security I employ personally. It's not that I'm lazy or incompetent. It's that I've made a conscious decision to accept certain risks in order to achieve certain rewards. For example, I don't bother trying to defend against nation state adversaries. I'm not a high value target. I don't have the resources (time) to defend against a nation state. I'd rather be nimble and flexible in my work capabilities, so I focus on the easy, low-hanging-fruit mitigations that will stop most (but not all) attackers.
Imagine that you reverse engineered a piece of malware in pain-staking detail, only to find that the malware author created a slightly modified version of the malware the next day. You wouldn't want to redo all your hard work. One way to avoid this is to use code comparison techniques to try to identify pairs of functions in the old and new version that are "the same" (which I put in quotes because it's a bit of a nebulous concept, as we'll see).
There are several tools to help in such situations. A very popular (formerly) commercial tool is zynamics' bindiff, which is now owned by Google and free. CMU SEI's Pharos also includes a code comparison utility called fn2hash, which is the subject of this blog post.
Background
Exact Hashing
fn2hash employs several types of hashing, with the most commonly used one called PIC hashing, where PIC stands for Position Independent Code. To see why PIC hashing is important, we'll actually start by looking at a naive precursor to PIC hashing, which is to simply hash the instruction bytes of a function. We'll call this exact hashing.
Let's look at an example. I compiled this simple program
oo.cpp with
g++. Here's the beginning of the assembly code for the function myfunc
(full
code):
Assembly code and bytes from oo.gcc
;;;;;;;;;;;;;;;;;;;;;;;;;;;;;;;;;;;;;;;;;;;;;;;;;;;;;;;;;;;;;;;;;;;;;;;;;;;;;;;;;;;;;;;;;;;;;;;;;;;;;;;;;;;;;;;;;;;;;;;;
;;; function 0x00401200 "myfunc()"
;;; mangled name is "_Z6myfuncv"
;;; reasons for function: referenced by symbol table

;; predecessor:  from instruction 0x004010f4 from basic block 0x004010f0
0x00401200: 41 56                      00 push     r140x00401202: bf 60 00 00 00            -08 mov      edi, 0x00000060<96>
0x00401207: 41 55                     -08 push     r13
0x00401209: 41 54                     -10 push     r12
0x0040120b: 55                        -18 push     rbp
0x0040120c: 48 83 ec 08               -20 sub      rsp, 8
0x00401210: e8 bb fe ff ff            -28 call     function 0x004010d0 "operator new(unsigned long)@plt"
Exact Bytes
In the first highlighted line, you can see that the first instruction is a
push r14, which is encoded by the instruction bytes 41 56. If we collect the
encoded instruction bytes for every instruction in the function, we get:
Exact bytes in oo.gcc
4156BF6000000041554154554883EC08E8BBFEFFFFBF6000000048C700F02040004889C548C7401010214000C740582A000000E898FEFFFFBF1000000048C700F02040004989C448C7401010214000C740582A000000E875FEFFFFBA0D000000BE48204000BF80404000C74008000000004989C5C6400C0048C700D8204000E82CFEFFFF488B05F52D0000488B40E84C8BB0704140004D85F60F842803000041807E38000F84160200004C89F7E898FBFFFF498B06BE0A000000488B4030483DD01540000F84CFFDFFFF4C89F7FFD00FBEF0E9C2FDFFFF410FBE7643BF80404000E827FEFFFF4889C7E8FFFDFFFF488B4500488B00483DE01740000F85AC0200004889EFFFD0488B4500488B4008483D601640000F84A0FDFFFFBA0D000000BE3A204000BF80404000E8C8FDFFFF488B05912D0000488B40E84C8BB0704140004D85F60F84C402000041807E38000F84820100004C89F7E8C8FBFFFF498B06BE0A000000488B4030483DD01540000F8463FEFFFF4C89F7FFD00FBEF0E956FEFFFF410FBE7643BF80404000E8C3FDFFFF4889C7E89BFDFFFF488B4500488B4008483D601640000F85600200004889EFFFD0E9E7FDFFFFBA0D000000BE1E204000BF80404000E863FDFFFF488B052C2D0000488B40E84C8BB0704140004D85F60F845F02000041807E38000F847D0100004C89F7E868FBFFFF498B06BE0A000000488B4030483DD01540000F8468FEFFFF4C89F7FFD00FBEF0E95BFEFFFF410FBE7643BF80404000E85EFDFFFF4889C7E836FDFFFF488B4510488D7D10488B4008483DE01540000F8506020000FFD0498B0424488B00483DE01740000F8449FEFFFFBA0D000000BE10204000BF80404000E8FAFCFFFF488B05C32C0000488B40E84C8BB0704140004D85F60F84F601000041807E38000F84440100004C89F7E838FBFFFF498B06BE0A000000488B4030483DD01540000F84A1FEFFFF4C89F7FFD00FBEF0E994FEFFFF410FBE7643BF80404000E8F5FCFFFF4889C7E8CDFCFFFF498B0424488B00483DE01740000F85B70100004C89E7FFD0E990FEFFFFBA0D000000BE3A204000BF80404000E896FCFFFF488B055F2C0000488B40E84C8BB0704140004D85F60F8492010000E864FAFFFF0F1F400041807E38000F84100100004C89F7E808FBFFFF498B06BE0A000000488B4030483DD01540000F84D5FEFFFF4C89F7FFD00FBEF0E9C8FEFFFF410FBE7643BF80404000E891FCFFFF4889C7E869FCFFFF4889EFBE60000000E8FC0300004C89E7BE10000000E8EF0300004883C4084C89EFBE100000005D415C415D415EE9D7030000We call this sequence the exact bytes of the function. We can hash these bytes to get an exact hash, 62CE2E852A685A8971AF291244A1283A.
Short-comings of Exact Hashing
The highlighted call at address 0x401210 is a relative call, which means that
the target is specified as an offset from the current instruction (well,
technically the next instruction). If you look at the instruction bytes for this
instruction, it includes the bytes bb fe ff ff, which is 0xfffffebb in little
endian form; interpreted as a signed integer value, this is -325. If we take
the address of the next instruction (0x401210 + 5 == 0x401215) and then add -325
to it, we get 0x4010d0, which is the address of operator new, the target of
the call. Yay. So now we know that bb fe ff ff is an offset from the next
instruction. Such offsets are called relative offsets because they are
relative to the address of the next instruction.
I created a slightly modified
program (oo2.gcc) by
adding an empty, unused function before myfunc. You can find the disassembly
of myfunc for this executable
here.
If we take the exact hash of myfunc in this new executable, we get
05718F65D9AA5176682C6C2D5404CA8D. Wait, that's different than the hash for
myfunc in the first executable, 62CE2E852A685A8971AF291244A1283A. What
happened? Let's look at the disassembly.
Assembly code and bytes from oo2.gcc
;;;;;;;;;;;;;;;;;;;;;;;;;;;;;;;;;;;;;;;;;;;;;;;;;;;;;;;;;;;;;;;;;;;;;;;;;;;;;;;;;;;;;;;;;;;;;;;;;;;;;;;;;;;;;;;;;;;;;;;;
;;; function 0x00401210 "myfunc()"

;; predecessor:  from instruction 0x004010f4 from basic block 0x004010f0
0x00401210: 41 56                      00 push     r14
0x00401212: bf 60 00 00 00            -08 mov      edi, 0x00000060<96>
0x00401217: 41 55                     -08 push     r13
0x00401219: 41 54                     -10 push     r12
0x0040121b: 55                        -18 push     rbp
0x0040121c: 48 83 ec 08               -20 sub      rsp, 8
0x00401220: e8 ab fe ff ff            -28 call     function 0x004010d0 "operator new(unsigned long)@plt"
Notice that myfunc moved from 0x401200 to 0x401210, which also moved the
address of the call instruction from 0x401210 to 0x401220. Because the call
target is specified as an offset from the (next) instruction's address, which
changed by 0x10 == 16, the offset bytes for the call changed from bb fe ff ff
(-325) to ab fe ff ff (-341 == -325 - 16). These changes modify the exact
bytes to:
Exact bytes in oo2.gcc
4156BF6000000041554154554883EC08E8ABFEFFFFBF6000000048C700F02040004889C548C7401010214000C740582A000000E888FEFFFFBF1000000048C700F02040004989C448C7401010214000C740582A000000E865FEFFFFBA0D000000BE48204000BF80404000C74008000000004989C5C6400C0048C700D8204000E81CFEFFFF488B05E52D0000488B40E84C8BB0704140004D85F60F842803000041807E38000F84160200004C89F7E888FBFFFF498B06BE0A000000488B4030483DE01540000F84CFFDFFFF4C89F7FFD00FBEF0E9C2FDFFFF410FBE7643BF80404000E817FEFFFF4889C7E8EFFDFFFF488B4500488B00483DF01740000F85AC0200004889EFFFD0488B4500488B4008483D701640000F84A0FDFFFFBA0D000000BE3A204000BF80404000E8B8FDFFFF488B05812D0000488B40E84C8BB0704140004D85F60F84C402000041807E38000F84820100004C89F7E8B8FBFFFF498B06BE0A000000488B4030483DE01540000F8463FEFFFF4C89F7FFD00FBEF0E956FEFFFF410FBE7643BF80404000E8B3FDFFFF4889C7E88BFDFFFF488B4500488B4008483D701640000F85600200004889EFFFD0E9E7FDFFFFBA0D000000BE1E204000BF80404000E853FDFFFF488B051C2D0000488B40E84C8BB0704140004D85F60F845F02000041807E38000F847D0100004C89F7E858FBFFFF498B06BE0A000000488B4030483DE01540000F8468FEFFFF4C89F7FFD00FBEF0E95BFEFFFF410FBE7643BF80404000E84EFDFFFF4889C7E826FDFFFF488B4510488D7D10488B4008483DF01540000F8506020000FFD0498B0424488B00483DF01740000F8449FEFFFFBA0D000000BE10204000BF80404000E8EAFCFFFF488B05B32C0000488B40E84C8BB0704140004D85F60F84F601000041807E38000F84440100004C89F7E828FBFFFF498B06BE0A000000488B4030483DE01540000F84A1FEFFFF4C89F7FFD00FBEF0E994FEFFFF410FBE7643BF80404000E8E5FCFFFF4889C7E8BDFCFFFF498B0424488B00483DF01740000F85B70100004C89E7FFD0E990FEFFFFBA0D000000BE3A204000BF80404000E886FCFFFF488B054F2C0000488B40E84C8BB0704140004D85F60F8492010000E854FAFFFF0F1F400041807E38000F84100100004C89F7E8F8FAFFFF498B06BE0A000000488B4030483DE01540000F84D5FEFFFF4C89F7FFD00FBEF0E9C8FEFFFF410FBE7643BF80404000E881FCFFFF4889C7E859FCFFFF4889EFBE60000000E8FC0300004C89E7BE10000000E8EF0300004883C4084C89EFBE100000005D415C415D415EE9D7030000You can look through that and see the differences by eyeballing it. Just kidding! Here's a visual comparison. Red represents bytes that are only in oo.gcc, and green represents bytes in oo2.gcc. The differences are small because the offset is only changing by 0x10, but this is enough to break exact hashing.
Difference between exact bytes in oo.gcc and oo2.gcc
4156BF6000000041554154554883EC08E8BBABFEFFFFBF6000000048C700F02040004889C548C7401010214000C740582A000000E89888FEFFFFBF1000000048C700F02040004989C448C7401010214000C740582A000000E87565FEFFFFBA0D000000BE48204000BF80404000C74008000000004989C5C6400C0048C700D8204000E82C1CFEFFFF488B05F5E52D0000488B40E84C8BB0704140004D85F60F842803000041807E38000F84160200004C89F7E89888FBFFFF498B06BE0A000000488B4030483DD0E01540000F84CFFDFFFF4C89F7FFD00FBEF0E9C2FDFFFF410FBE7643BF80404000E82717FEFFFF4889C7E8FFEFFDFFFF488B4500488B00483DE0F01740000F85AC0200004889EFFFD0488B4500488B4008483D60701640000F84A0FDFFFFBA0D000000BE3A204000BF80404000E8C8B8FDFFFF488B0591812D0000488B40E84C8BB0704140004D85F60F84C402000041807E38000F84820100004C89F7E8C8B8FBFFFF498B06BE0A000000488B4030483DD0E01540000F8463FEFFFF4C89F7FFD00FBEF0E956FEFFFF410FBE7643BF80404000E8C3B3FDFFFF4889C7E89B8BFDFFFF488B4500488B4008483D60701640000F85600200004889EFFFD0E9E7FDFFFFBA0D000000BE1E204000BF80404000E86353FDFFFF488B052C1C2D0000488B40E84C8BB0704140004D85F60F845F02000041807E38000F847D0100004C89F7E86858FBFFFF498B06BE0A000000488B4030483DD0E01540000F8468FEFFFF4C89F7FFD00FBEF0E95BFEFFFF410FBE7643BF80404000E85E4EFDFFFF4889C7E83626FDFFFF488B4510488D7D10488B4008483DE0F01540000F8506020000FFD0498B0424488B00483DE0F01740000F8449FEFFFFBA0D000000BE10204000BF80404000E8FAEAFCFFFF488B05C3B32C0000488B40E84C8BB0704140004D85F60F84F601000041807E38000F84440100004C89F7E83828FBFFFF498B06BE0A000000488B4030483DD0E01540000F84A1FEFFFF4C89F7FFD00FBEF0E994FEFFFF410FBE7643BF80404000E8F5E5FCFFFF4889C7E8CDBDFCFFFF498B0424488B00483DE0F01740000F85B70100004C89E7FFD0E990FEFFFFBA0D000000BE3A204000BF80404000E89686FCFFFF488B055F4F2C0000488B40E84C8BB0704140004D85F60F8492010000E86454FAFFFF0F1F400041807E38000F84100100004C89F7E808FBF8FAFFFF498B06BE0A000000488B4030483DD0E01540000F84D5FEFFFF4C89F7FFD00FBEF0E9C8FEFFFF410FBE7643BF80404000E89181FCFFFF4889C7E86959FCFFFF4889EFBE60000000E8FC0300004C89E7BE10000000E8EF0300004883C4084C89EFBE100000005D415C415D415EE9D7030000
PIC Hashing
This problem is the motivation for few different types of hashing that we'll
talk about in this blog post, including PIC hashing and fuzzy hashing. The
PIC in PIC hashing stands for Position Independent Code. At a high level,
the goal of PIC hashing is to compute a hash or signature of code, but do so in
a way that relocating the code will not change the hash. This is important
because, as we just saw, modifying a program often results in small changes to
addresses and offsets and we don't want these changes to modify the hash!. The
intuition behind PIC hashing is very straight-forward: identify offsets and
addresses that are likely to change if the program is recompiled, such as bb fe ff ff,
and simply set them to zero before hashing the bytes. That way if they
change because the function is relocated, the function's PIC hash won't change.
The following visual diff shows the differences between the exact bytes and the
PIC bytes on myfunc in oo.gcc. Red represents bytes that are only in the PIC
bytes, and green represents the exact bytes. As expected, the first
change we can see is the byte sequence bb fe ff ff, which is changed to zeros.
Byte difference between PIC bytes (red) and exact bytes (green)
4156BF6000000041554154554883EC08E800000000BBFEFFFFBF6000000048C700000000F02040004889C548C7401000000010214000C740582A000000E80000000098FEFFFFBF1000000048C700000000F02040004989C448C7401000000010214000C740582A000000E80000000075FEFFFFBA0D000000BE00000048204000BF00000080404000C74008000000004989C5C6400C0048C700000000D8204000E8000000002CFEFFFF488B050000F52D0000488B40E84C8BB0000000704140004D85F60F842803000041807E38000F84160200004C89F7E80000000098FBFFFF498B06BE0A000000488B4030483D000000D01540000F84CFFDFFFF4C89F7FFD00FBEF0E9C2FDFFFF410FBE7643BF00000080404000E80000000027FEFFFF4889C7E800000000FFFDFFFF488B4500488B00483D000000E01740000F85AC0200004889EFFFD0488B4500488B4008483D000000601640000F84A0FDFFFFBA0D000000BE0000003A204000BF00000080404000E800000000C8FDFFFF488B050000912D0000488B40E84C8BB0000000704140004D85F60F84C402000041807E38000F84820100004C89F7E800000000C8FBFFFF498B06BE0A000000488B4030483D000000D01540000F8463FEFFFF4C89F7FFD00FBEF0E956FEFFFF410FBE7643BF00000080404000E800000000C3FDFFFF4889C7E8000000009BFDFFFF488B4500488B4008483D000000601640000F85600200004889EFFFD0E9E7FDFFFFBA0D000000BE0000001E204000BF00000080404000E80000000063FDFFFF488B0500002C2D0000488B40E84C8BB0000000704140004D85F60F845F02000041807E38000F847D0100004C89F7E80000000068FBFFFF498B06BE0A000000488B4030483D000000D01540000F8468FEFFFF4C89F7FFD00FBEF0E95BFEFFFF410FBE7643BF00000080404000E8000000005EFDFFFF4889C7E80000000036FDFFFF488B4510488D7D10488B4008483D000000E01540000F8506020000FFD0498B0424488B00483D000000E01740000F8449FEFFFFBA0D000000BE00000010204000BF00000080404000E800000000FAFCFFFF488B050000C32C0000488B40E84C8BB0000000704140004D85F60F84F601000041807E38000F84440100004C89F7E80000000038FBFFFF498B06BE0A000000488B4030483D000000D01540000F84A1FEFFFF4C89F7FFD00FBEF0E994FEFFFF410FBE7643BF00000080404000E800000000F5FCFFFF4889C7E800000000CDFCFFFF498B0424488B00483D000000E01740000F85B70100004C89E7FFD0E990FEFFFFBA0D000000BE0000003A204000BF00000080404000E80000000096FCFFFF488B0500005F2C0000488B40E84C8BB0000000704140004D85F60F8492010000E80000000064FAFFFF0F1F400041807E38000F84100100004C89F7E80000000008FBFFFF498B06BE0A000000488B4030483D000000D01540000F84D5FEFFFF4C89F7FFD00FBEF0E9C8FEFFFF410FBE7643BF00000080404000E80000000091FCFFFF4889C7E80000000069FCFFFF4889EFBE60000000E80000FC0300004C89E7BE10000000E80000EF0300004883C4084C89EFBE100000005D415C415D415EE90000D7030000
If we hash the PIC bytes, we get the PIC hash
EA4256ECB85EDCF3F1515EACFA734E17. And, as we would hope, we get the same PIC
hash for myfunc in the slightly modified oo2.gcc.
Evaluating the Accuracy of PIC Hashing
The primary motivation behind PIC hashing is to detect identical code that is moved to a different location. But what if two pieces of code are compiled with different compilers or different compiler flags? What if two functions are very similar, but one has a line of code removed? Because these changes would modify the non-offset bytes that are used in the PIC hash, it would change the PIC hash of the code. Since we know that PIC hashing will not always work, in this section we'll discuss how we can measure the performance of PIC hashing and compare it to other code comparison techniques.
Before we can define the accuracy of any code comparison technique, we'll need some ground truth that tells us which functions are equivalent. For this blog post, we'll use compiler debug symbols to map function addresses to their names. This will provide us with a ground truth set of functions and their names. For the purposes of this blog post, and general expediency, we'll assume that if two functions have the same name, they are "the same". (This obviously is not true in general!)
Confusion Matrices
So, let's say we have two similar executables, and we want to evaluate how well PIC hashing can identify equivalent functions across both executables. We'll start by considering all possible pairs of functions, where each pair contains a function from each executable. If we're being mathy, this is called the cartesian product (between the functions in the first executable and the functions in the second executable). For each function pair, we'll use the ground truth to determine if the functions are the same by seeing if they have the same name. Then we'll use PIC hashing to predict whether the functions are the same by computing their hashes and seeing if they are identical. There are two outcomes for each determination, so there are four possibilities in total:
- True Positive (TP): PIC hashing correctly predicted the functions are equivalent.
- True Negative (TN): PIC hashing correctly predicted the functions are different.
- False Positive (FP): PIC hashing incorrectly predicted the functions are equivalent, but they are not.
- False Negative (FN): PIC hashing incorrectly predicted the functions are different, but they are equivalent.
To make it a little easier to interpret, we color the good outcomes green and the bad outcomes red.
We can represent these in what is called a confusion matrix:
| Hashing says same | Hashing says different | |
|---|---|---|
| Ground truth says same | TP | FN |
| Ground truth says different | FP | TN |
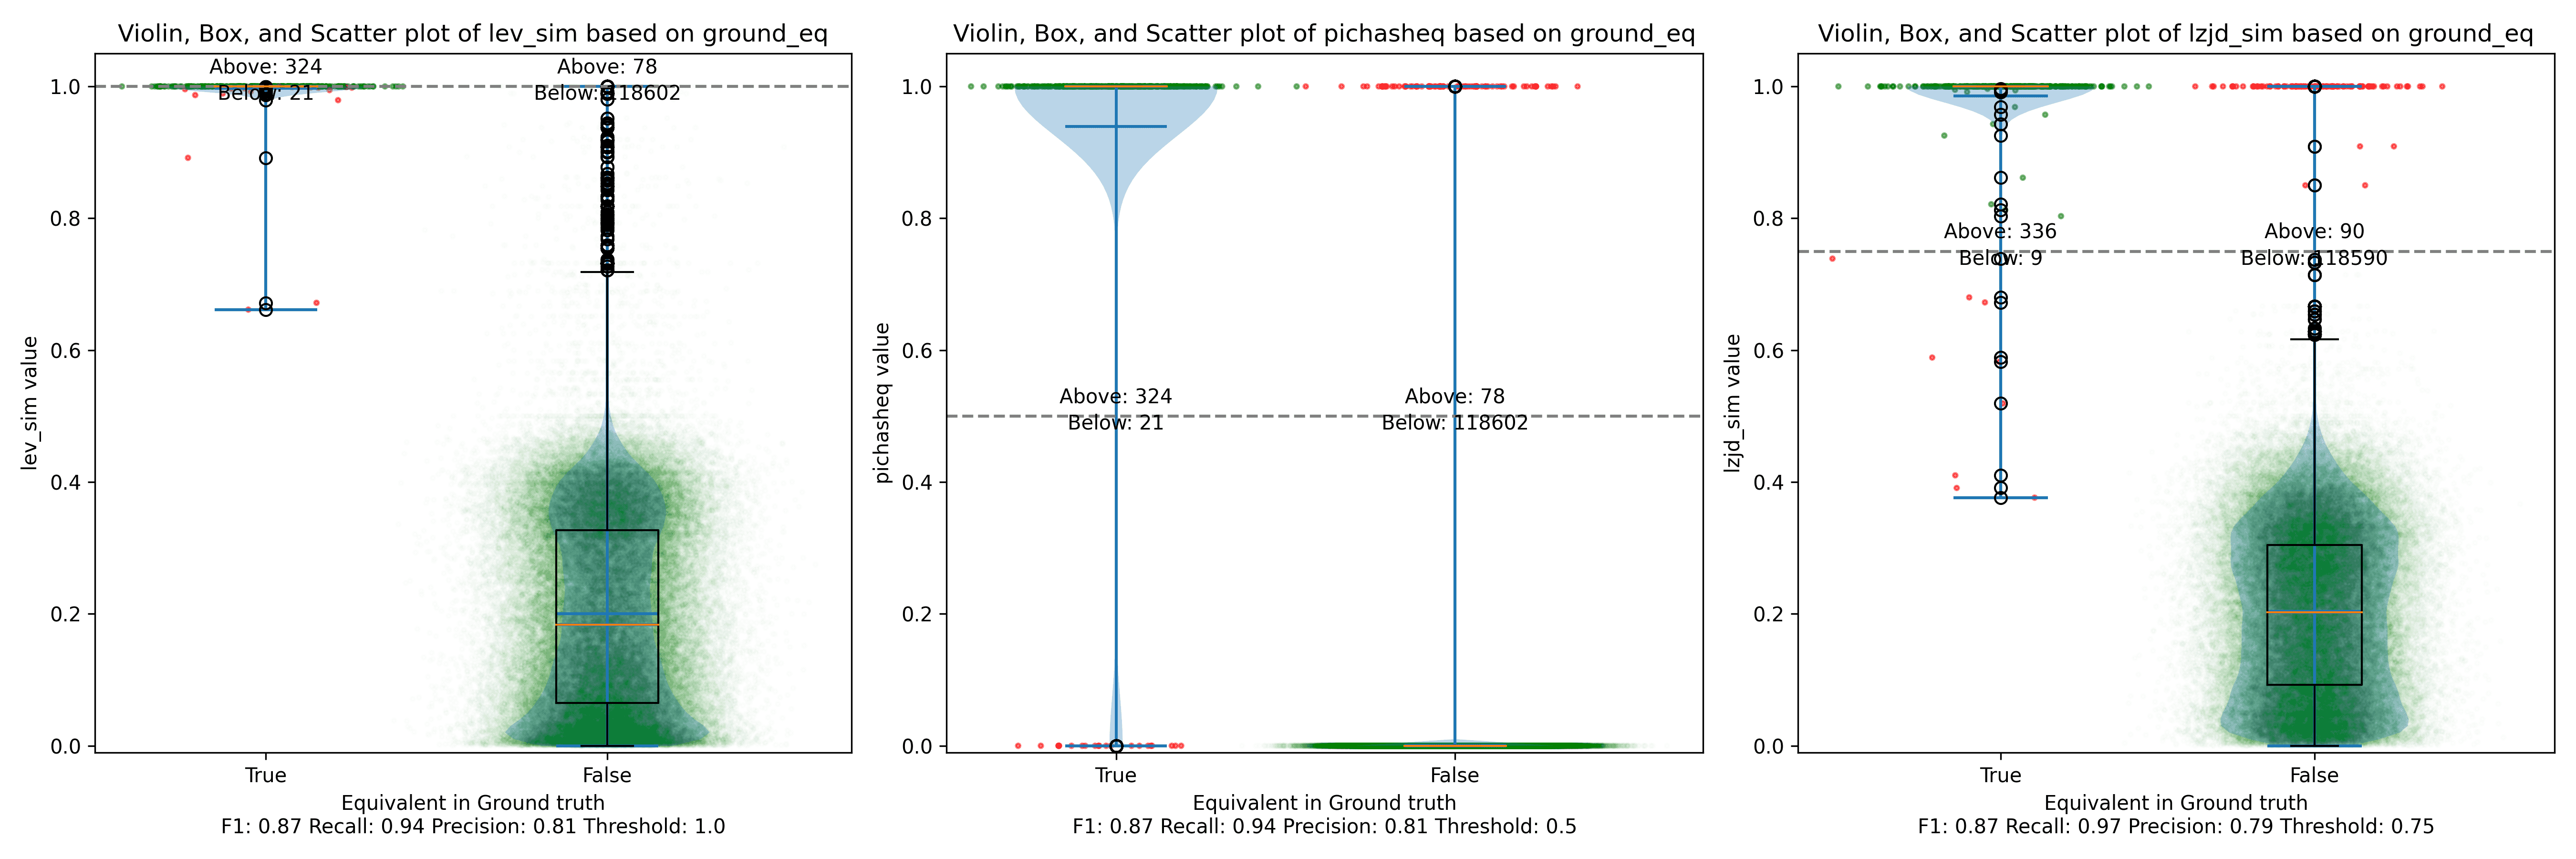
For example, here is a confusion matrix from an experiment where I use PIC hashing to compare openssl versions 1.1.1w and 1.1.1v when they are both compiled in the same manner. These two versions of openssl are very similar, so we would expect that PIC hashing would do well because a lot of functions will be identical but shifted to different addresses. And, indeed, it does:
| Hashing says same | Hashing says different | |
|---|---|---|
| Ground truth says same | 344 | 1 |
| Ground truth says different | 78 | 118,602 |
Metrics: Accuracy, Precision, and Recall
So when does PIC hashing work well, and when does it not? In order to answer these questions, we're going to need an easier way to evaluate the quality of a confusion matrix as a single number. At first glance, accuracy seems like the most natural metric, which tell us: How many pairs did hashing predict correctly? This is equal to
For the above example, PIC hashing achieved an accuracy of
99.9% accuracy. Pretty good, right?
But if you look closely, there's a subtle problem. Most function pairs are not equivalent. According to the ground truth, there are equivalent function pairs, and non-equivalent function pairs. So, if we just guessed that all function pairs were non-equivalent, we would still be right of the time. Since accuracy weights all function pairs equally, it is not the best metric here.
Instead, we want a metric that emphasizes positive results, which in this case are equivalent function pairs. This is consistent with our goal in reverse engineering, because knowing that two functions are equivalent allows a reverse engineer to transfer knowledge from one executable to another and save time!
Three metrics that focus more on positive cases (i.e., equivalent functions) are precision, recall, and F1 score:
- Precision: Of the function pairs hashing declared equivalent, how many were actually equivalent? This is equal to .
- Recall: Of the equivalent function pairs, how many did hashing correctly declare as equivalent? This is equal to .
- F1 score: This is a single metric that reflects both the Precision and Recall. Specifically, it is the harmonic mean of the Precision and Recall, or . Compared to the arithmetic mean, the harmonic mean is more sensitive to low values. This means that if either Precision or Recall is low, the F1 score will also be low.
So, looking at the above example, we can compute the precision, recall, and F1 score. The precision is , the recall is , and the F1 score is . So, PIC hashing is able to identify 81% of equivalent function pairs, and when it does declare a pair is equivalent, it is correct 99.7% of the time. This corresponds to a F1 score of 0.89 out of 1.0, which is pretty good!
Now, you might be wondering how well PIC hashing performs when the differences between executables are larger.
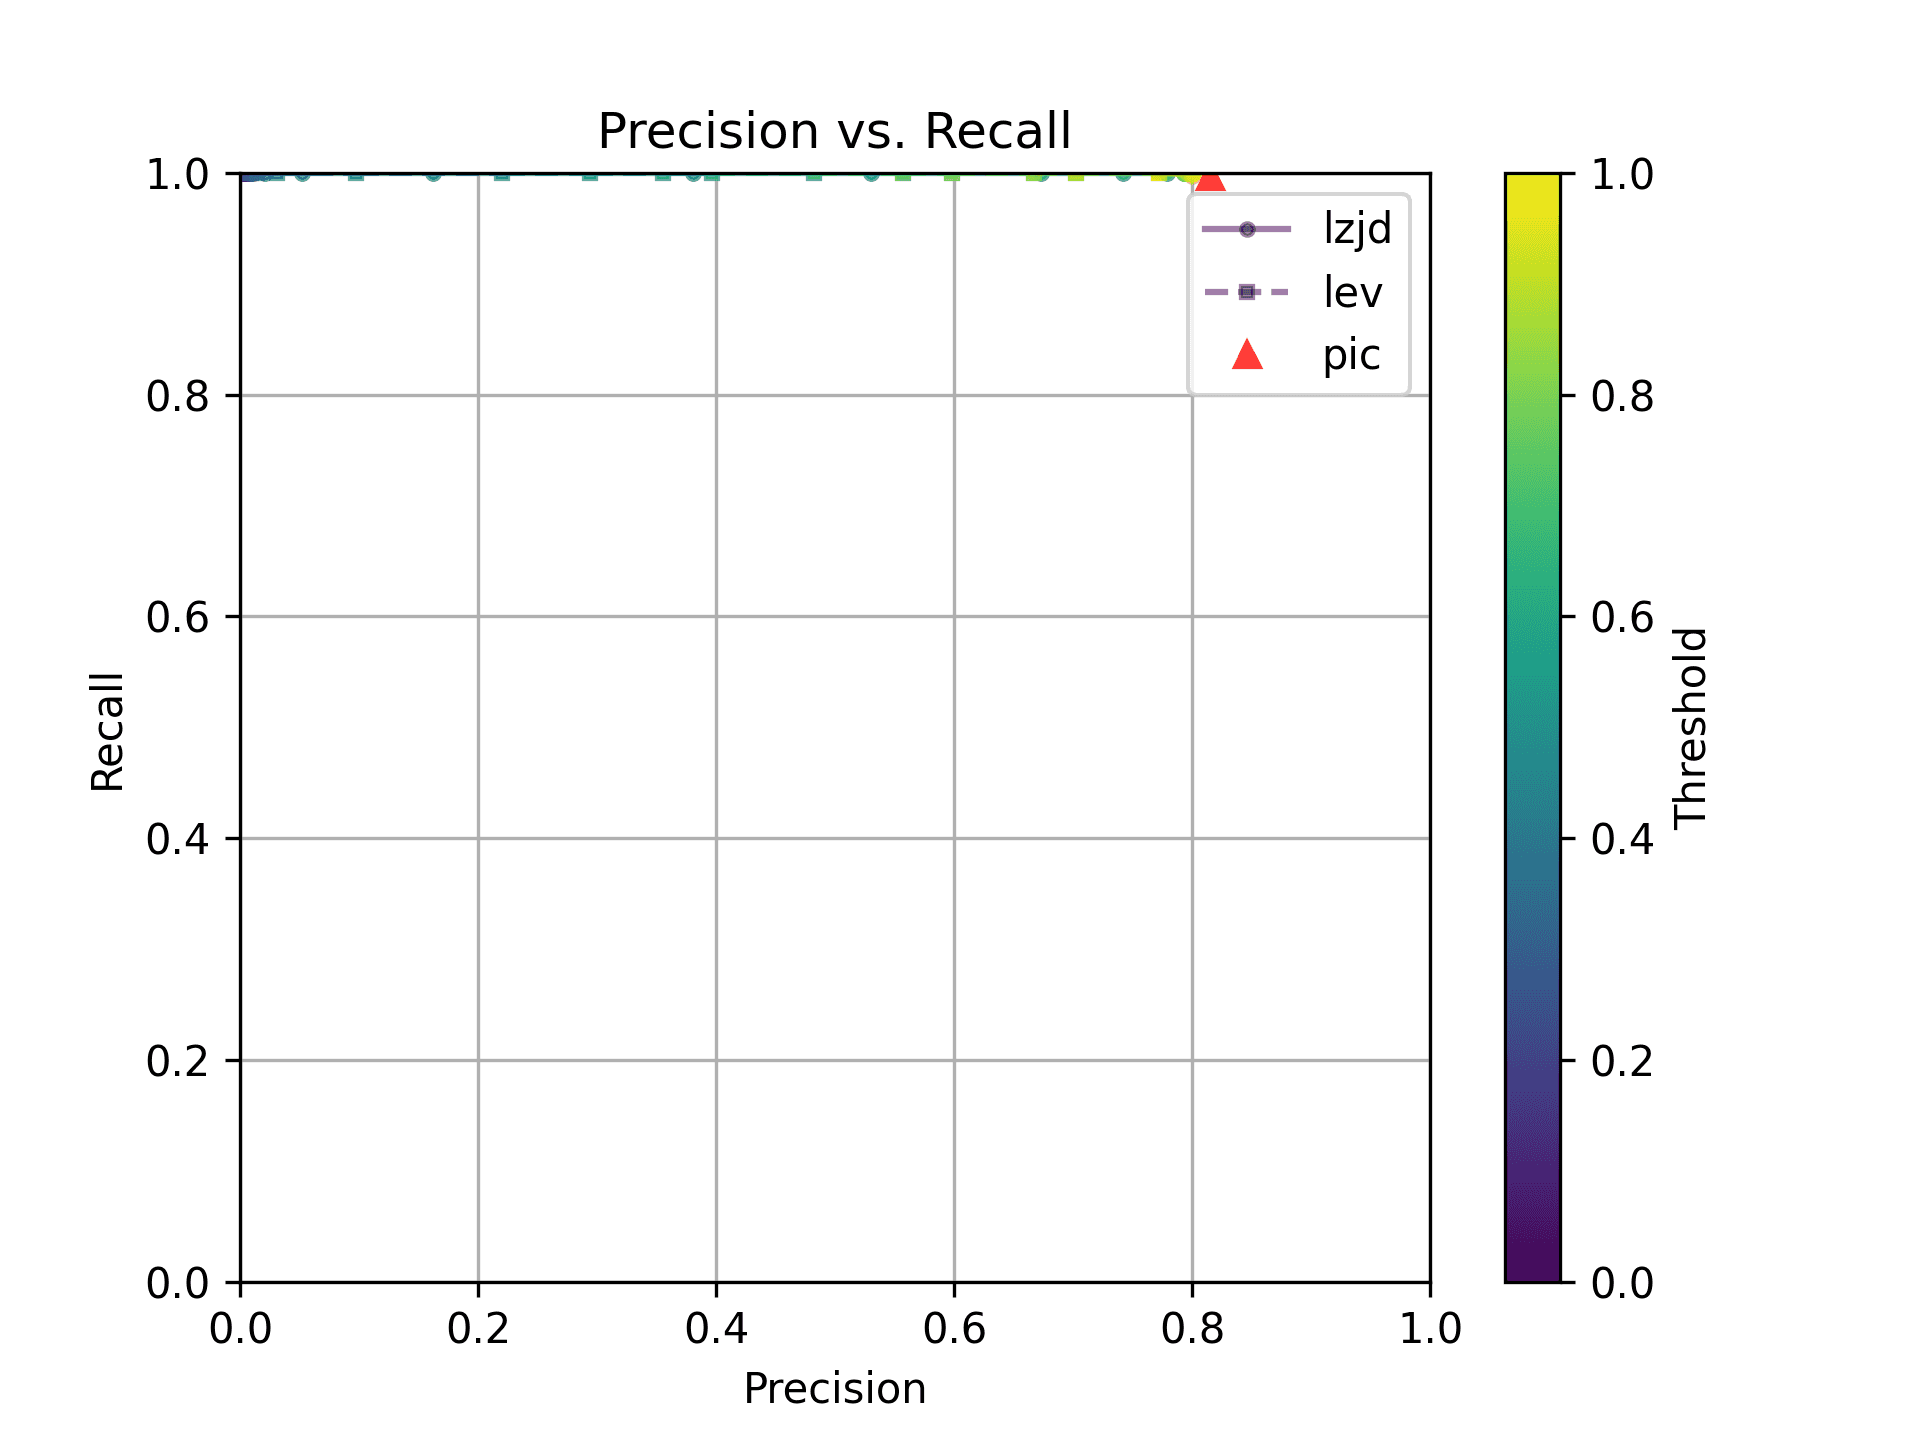
Let's look at another experiment. In this one, I compare an openssl executable compiled with gcc to one compiled with clang. Because gcc and clang generate assembly code differently, we would expect there to be a lot more differences.
Here is a confusion matrix from this experiment:
| Hashing says same | Hashing says different | |
|---|---|---|
| Ground truth says same | 23 | 301 |
| Ground truth says different | 31 | 117,635 |
In this example, PIC hashing achieved a recall of , and a precision of . So, hashing is only able to identify 7% of equivalent function pairs, but when it does declare a pair is equivalent, it is correct 43% of the time. This corresponds to a F1 score of 0.12 out of 1.0, which is pretty bad. Imagine that you spent hours reverse engineering the 324 functions in one of the executables, only to find that PIC hashing was only able to identify 23 of them in the other executable, so you would be forced to needlessly reverse engineer the other functions from scratch. That would be pretty frustrating! Can we do better?
The Great Fuzzy Hashing Debate
There's a very different type of hashing called fuzzy hashing. Like regular
hashing, there is a hash function that reads a sequence of bytes and produces a hash.
Unlike regular hashing, though, you don't compare fuzzy hashes with equality.
Instead, there is a similarity function which takes two fuzzy hashes as input,
and returns a number between 0 and 1, where 0 means completely dissimilar, and 1
means completely similar.
My colleague, Cory Cohen, and I, actually debated whether there is utility in applying fuzzy hashes to instruction bytes, and our debate motivated this blog post. I thought there would be a benefit, but Cory felt there would not. Hence these experiments! For this blog post, I'll be using the Lempel-Ziv Jaccard Distance fuzzy hash, or just LZJD for short, because it's very fast. Most fuzzy hash algorithms are pretty slow. In fact, learning about LZJD is what motivated our debate. The possibility of a fast fuzzy hashing algorithm opens up the possibility of using fuzzy hashes to search for similar functions in a large database and other interesting possibilities.
I'll also be using Levenshtein distance as a baseline. Levenshtein distance is a measure of how many changes you need to make to one string to transform it to another. For example, the Levenshtein distance between "cat" and "bat" is 1, because you only need to change the first letter. Levenshtein distance allows us to define an optimal notion of similarity at the instruction byte level. The trade-off is that it's really slow, so it's only really useful as a baseline in our experiments.
Experiments
To test the accuracy of PIC hashing under various scenarios, I defined a few experiments. Each experiment takes a similar (or identical) piece of source code and compiles it, sometimes with different compilers or flags.
Experiment 1: openssl 1.1.1w
In this experiment, I compiled openssl 1.1.1w in a few different ways. In each
case, I examined the resulting openssl executable.
Experiment 1a: openssl1.1.1w Compiled With Different Compilers
In this first experiment, I compiled openssl 1.1.1w with gcc -O3 -g and clang
-O3 -g and compared the results. We'll start with the confusion matrix for PIC
hashing:
| Hashing says same | Hashing says different | |
|---|---|---|
| Ground truth says same | 23 | 301 |
| Ground truth says different | 31 | 117,635 |
As we saw earlier, this results in a recall of 0.07, a precision of 0.45, and a F1 score of 0.12. To summarize: pretty bad.
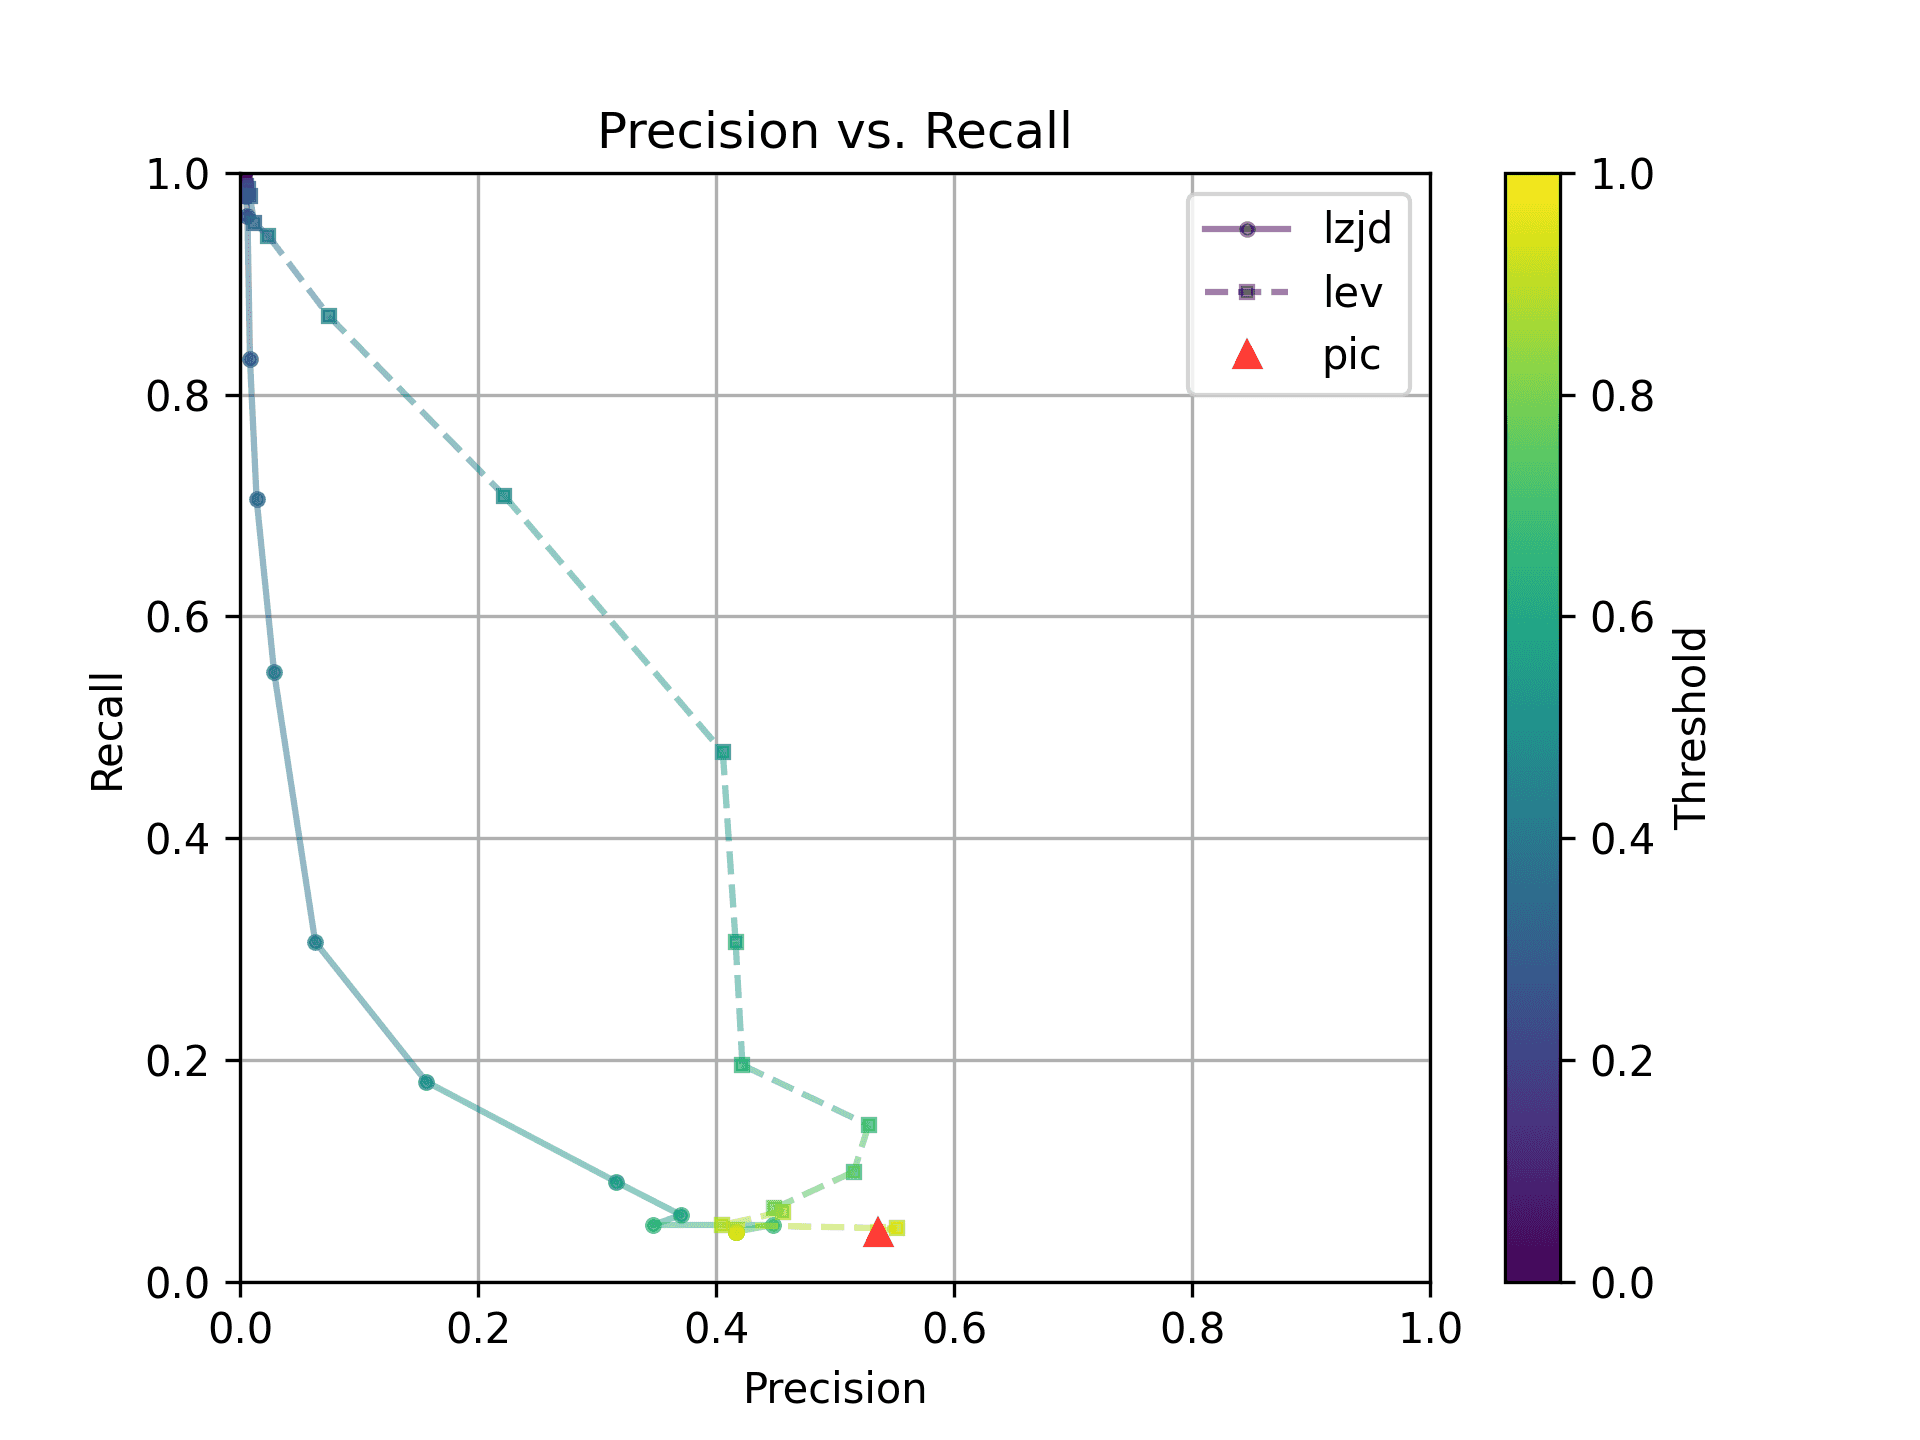
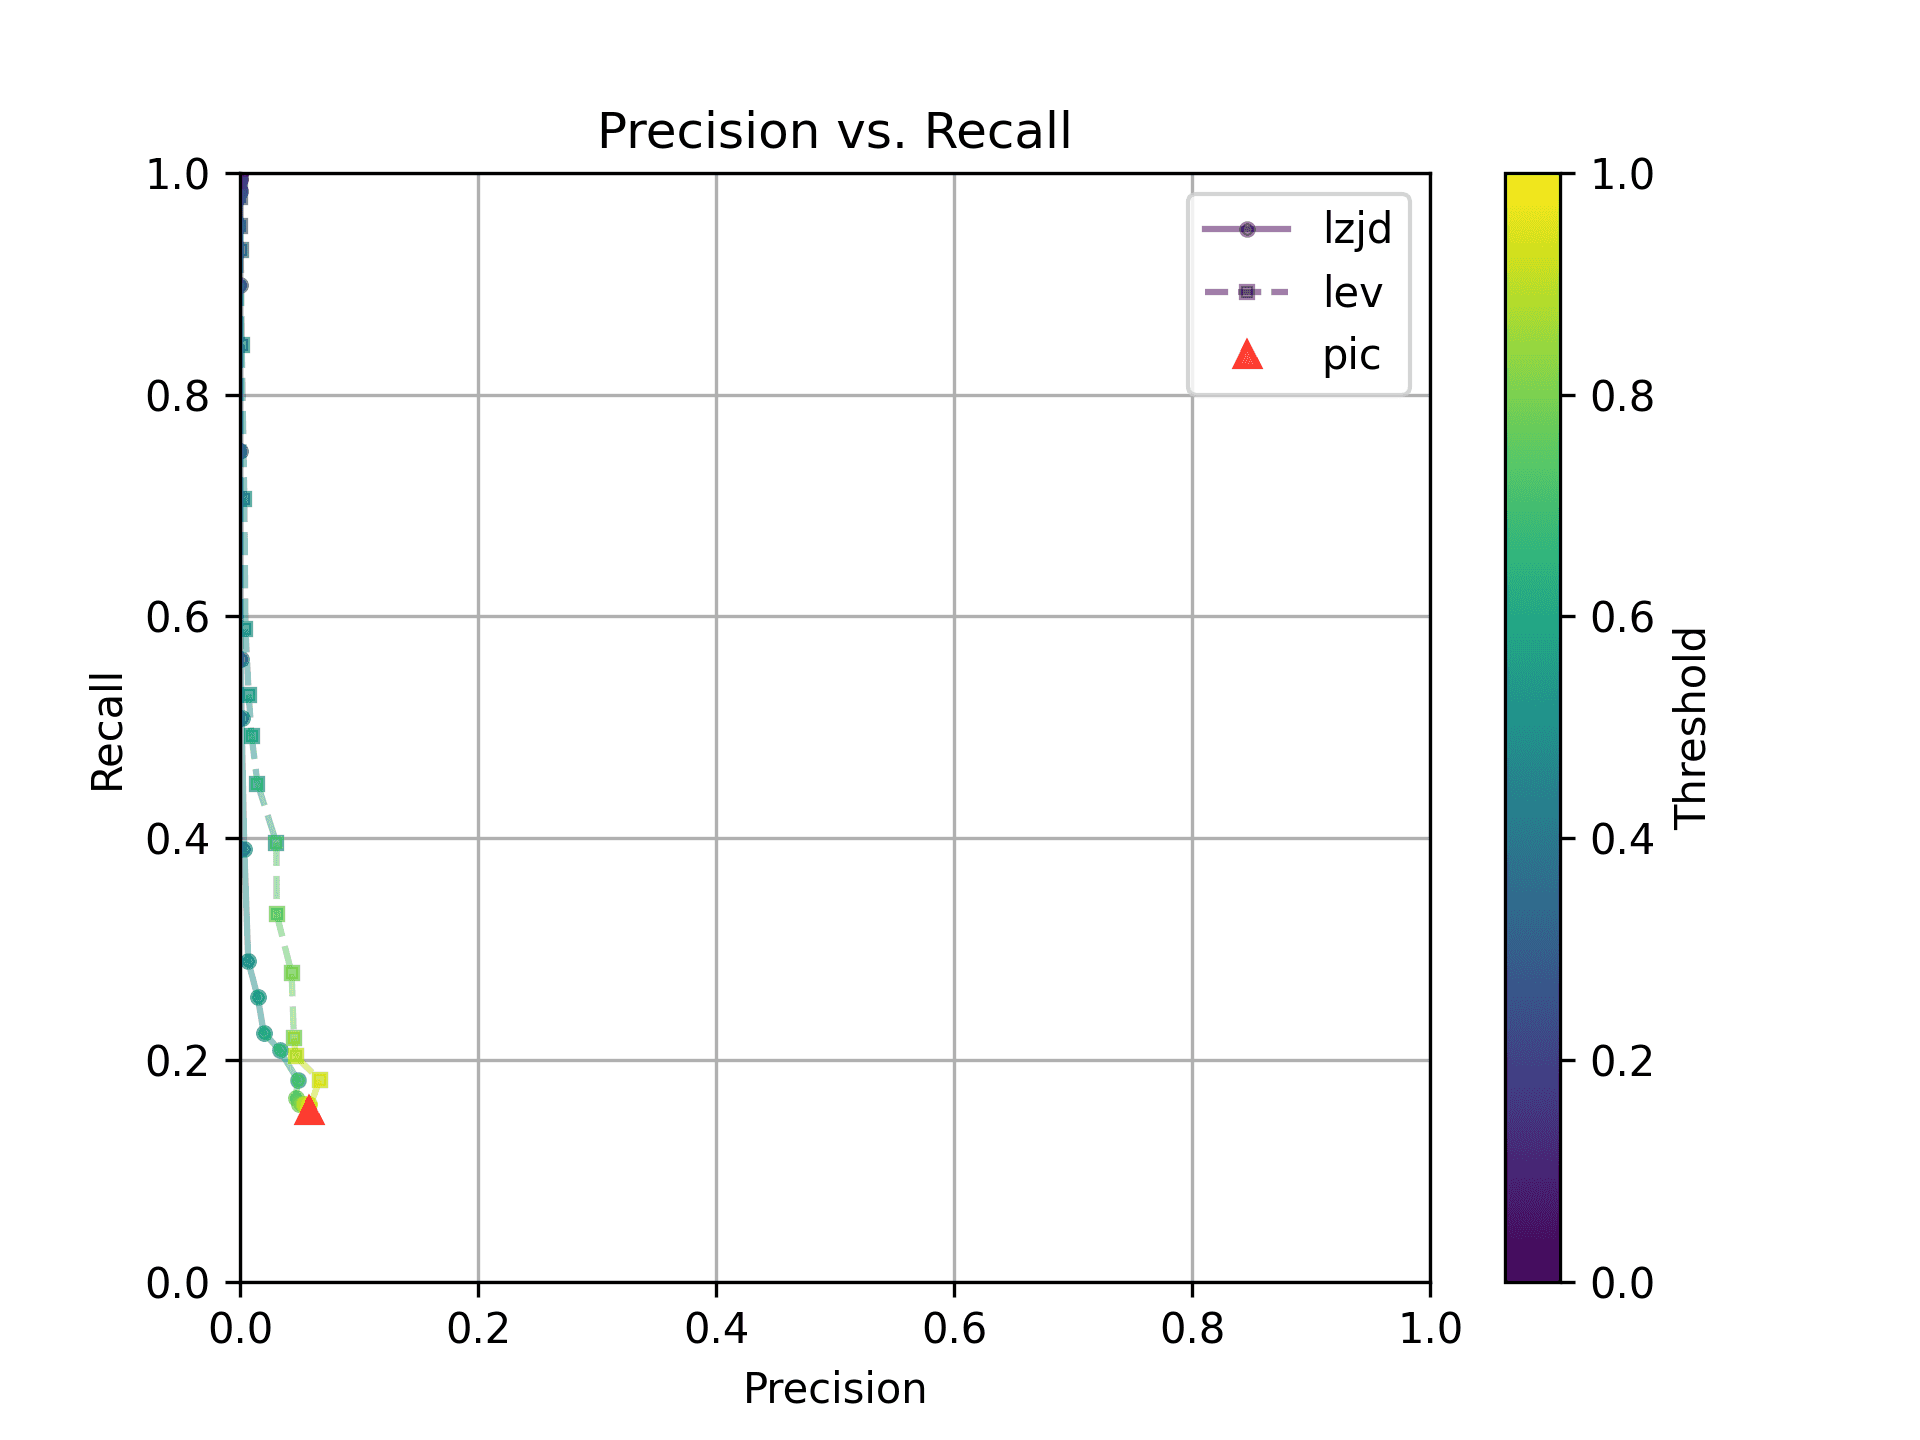
How do LZJD and LEV do? Well, that's a bit harder to quantify, because we have to pick a similarity threshold at which we consider the function to be "the same". For example, at a threshold of 0.8, we'd consider a pair of functions to be the same if they had a similarity score of 0.8 or higher. To communicate this information, we could output a confusion matrix for each possible threshold. Instead of doing this, I'll plot the results for a range of thresholds below:
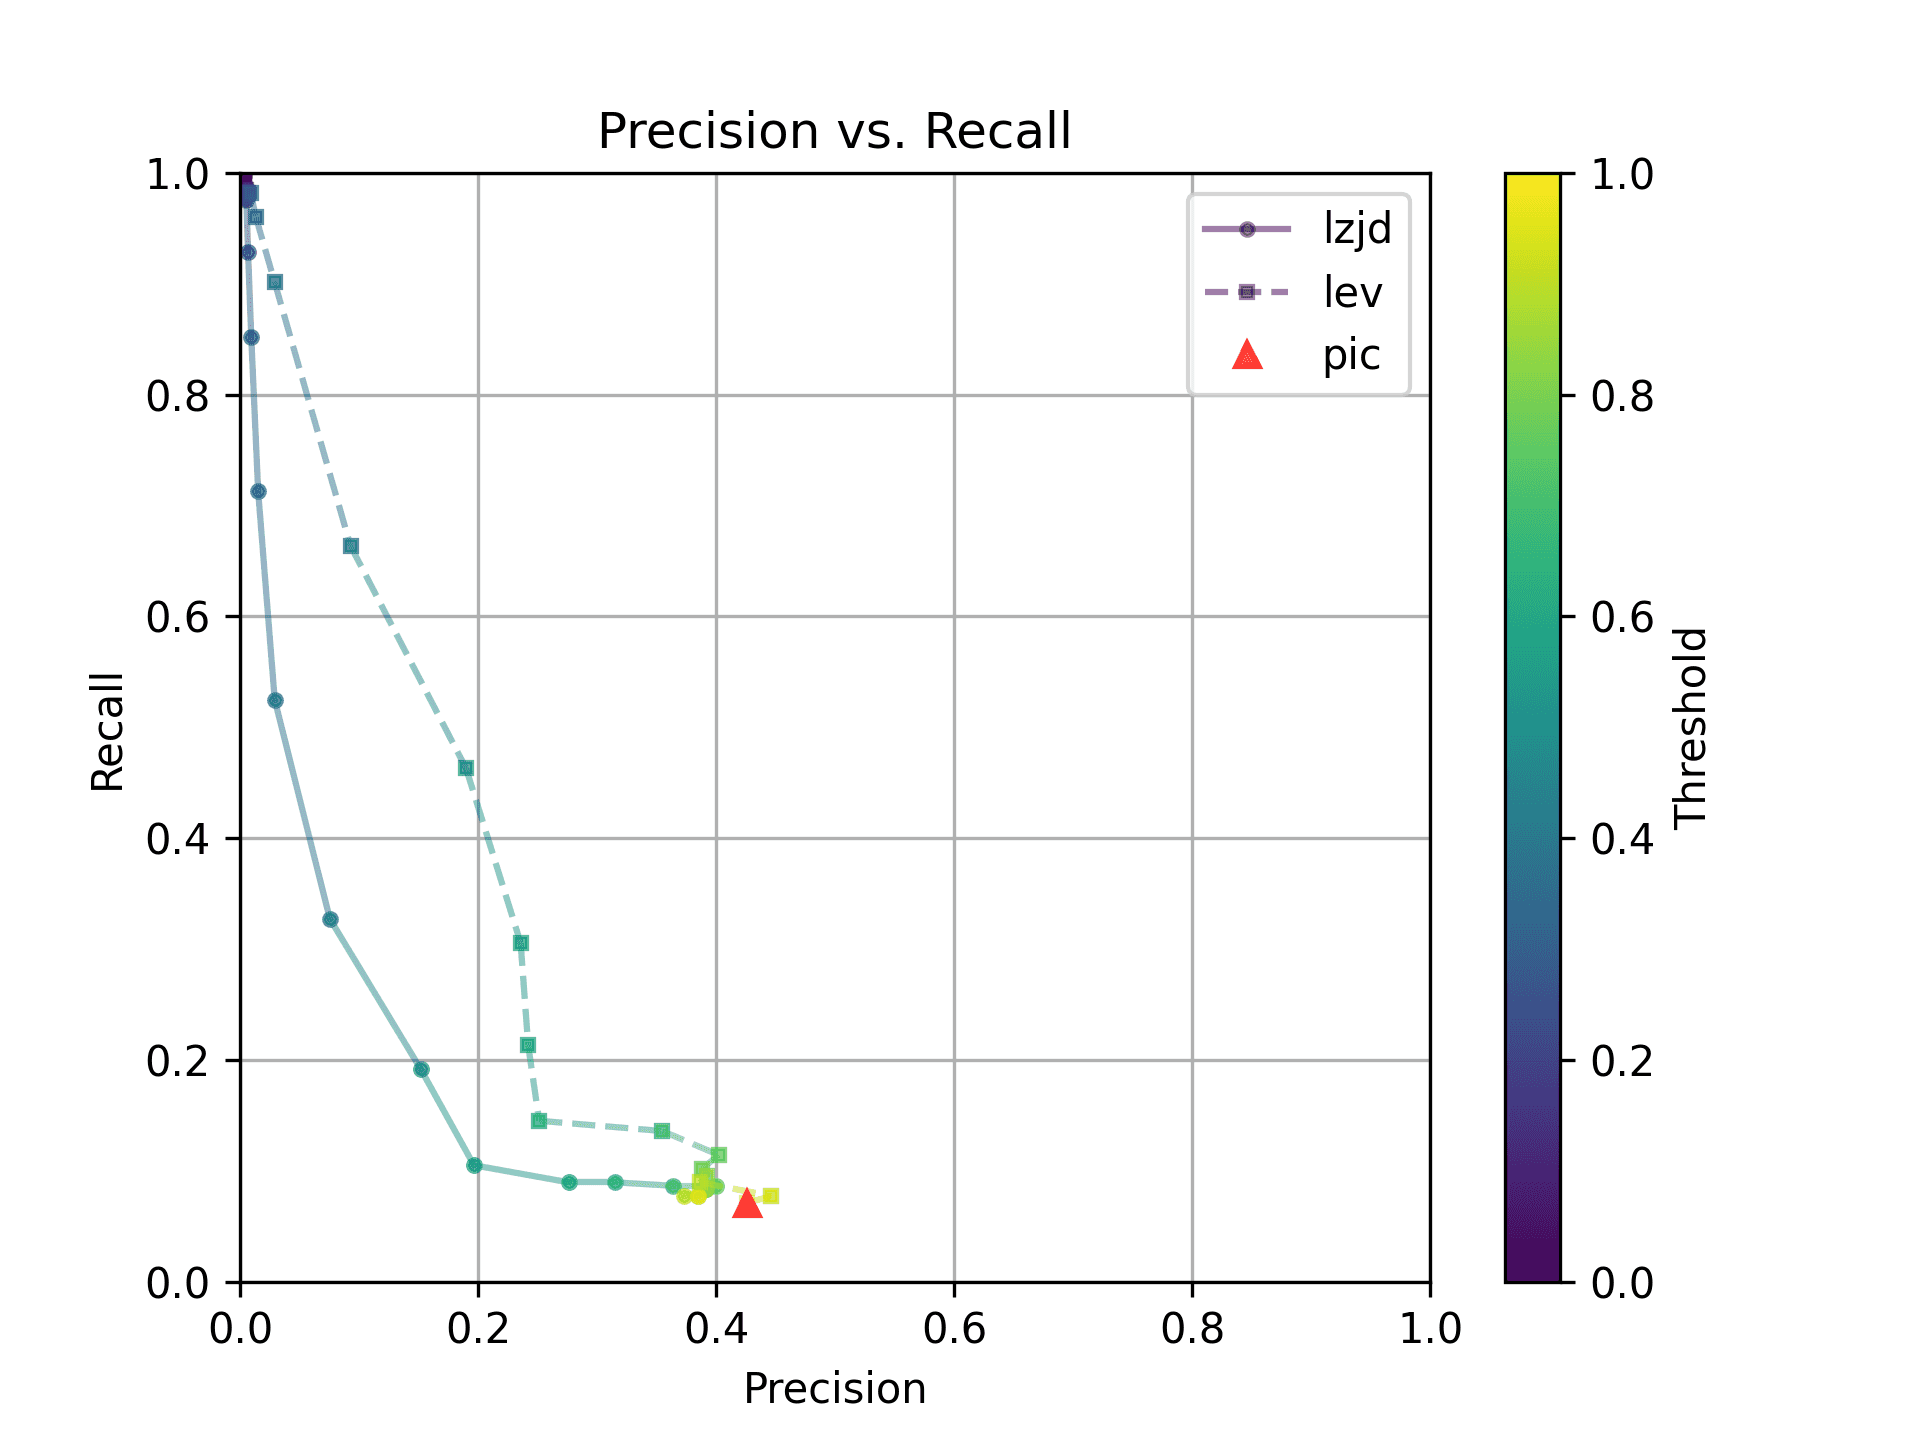
The red triangle represents the precision and recall of PIC hashing: 0.45 and 0.07 respectively, just like we got above. The solid line represents the performance of LZJD, and the dashed line represents the performance of LEV (Levenshtein distance). The color tells us what threshold is being used for LZJD and LEV. On this graph, the ideal result would be at the top right (100% recall and precision). So, for LZJD and LEV to have an advantage, it should be above or to the right of PIC hashing. But we can see that both LZJD and LEV go sharply to the left before moving up, which indicates that a substantial decrease in precision is needed to improve recall.
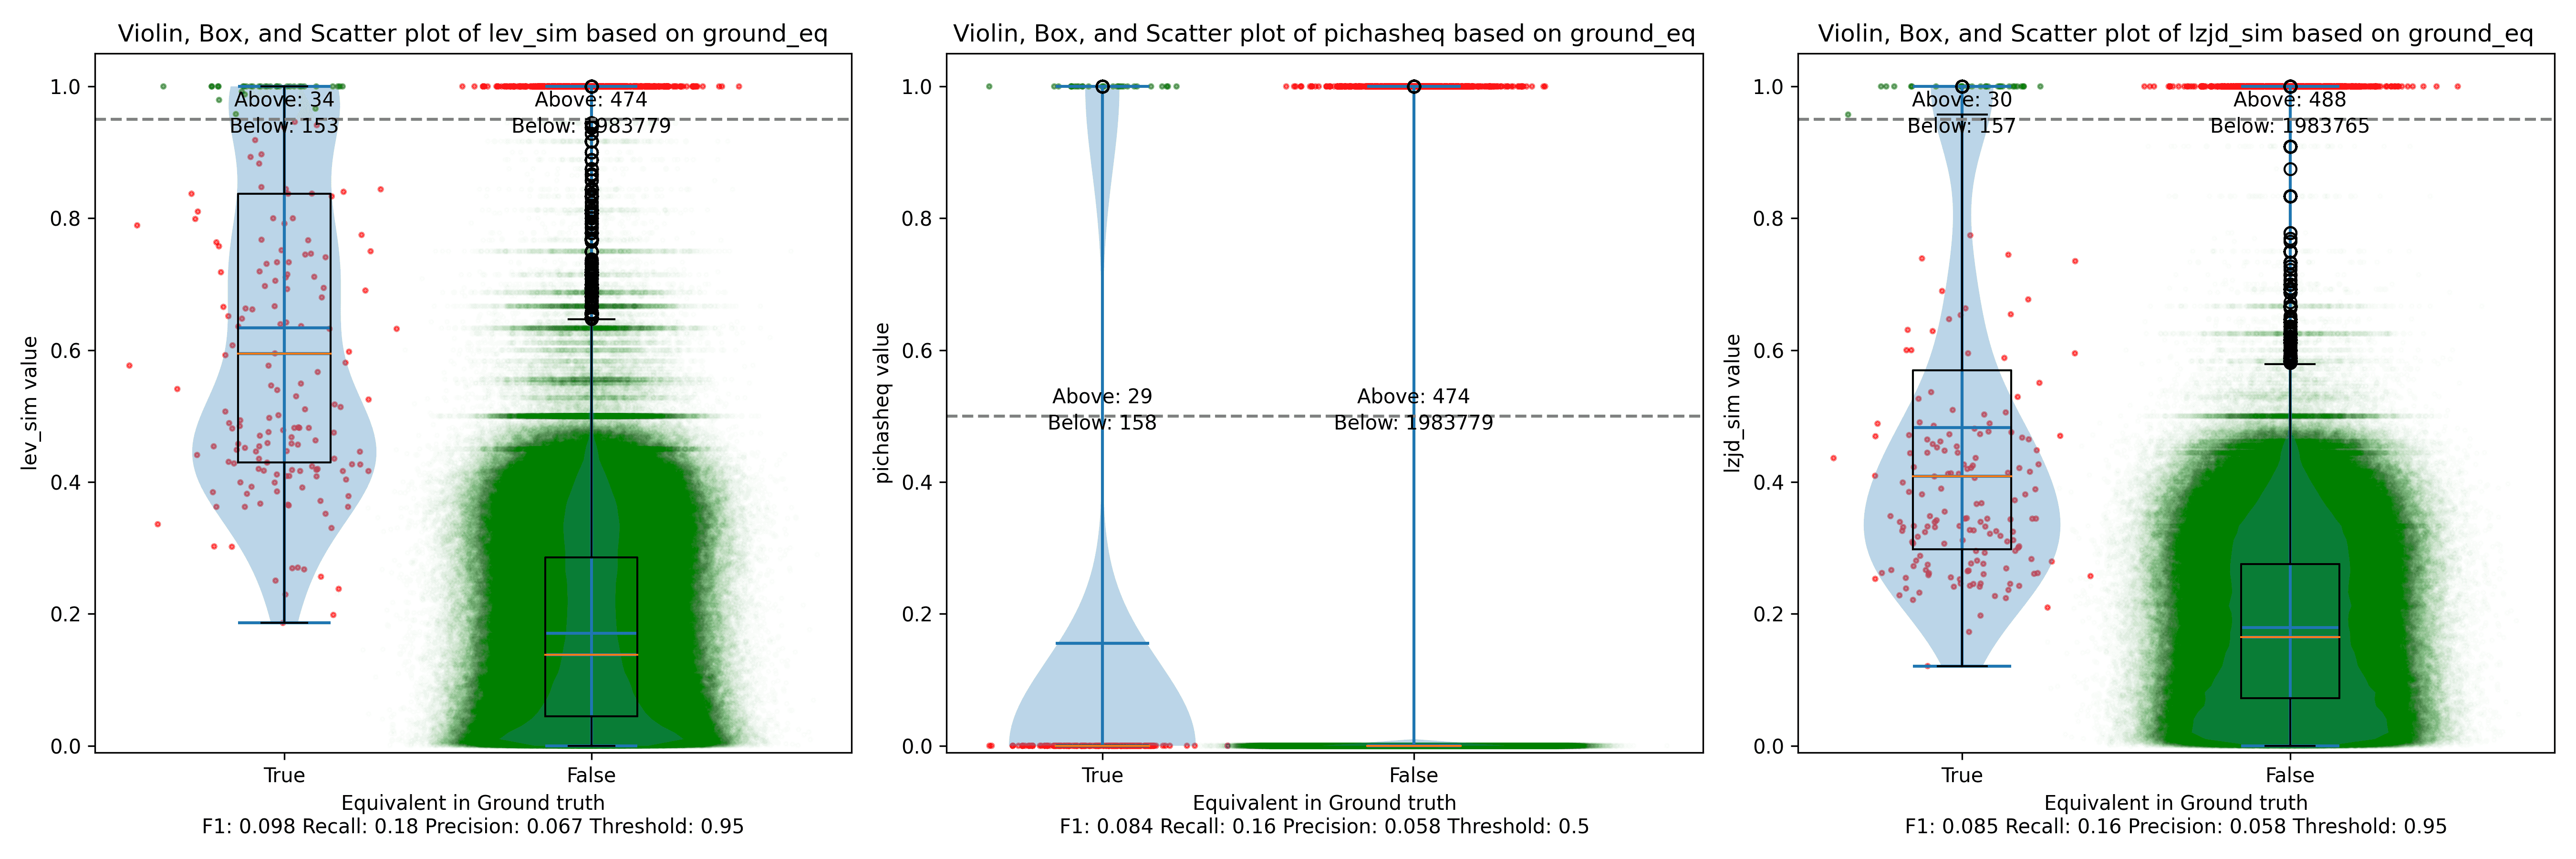
Below is what I call the violin plot. You may want to click on it to zoom in, since it's pretty wide and my blog layout is not. I also spent a long time getting that to work! There are three panels: the leftmost is for LEV, the middle is for PIC hashing, and the rightmost is for LZJD. On each panel, there is a True column, which shows the distribution of similarity scores for equivalent pairs of functions. There is also a False column, which shows the distribution scores for non-equivalent pairs of functions. Since PIC hashing does not provide a similarity score, we consider every pair to be either equivalent (1.0) or not (0.0). A horizontal dashed line is plotted to show the threshold that has the highest F1 score (i.e., a good combination of both precision and recall). Green points indicate function pairs that are correctly predicted as equivalent or not, whereas red points indicate mistakes.
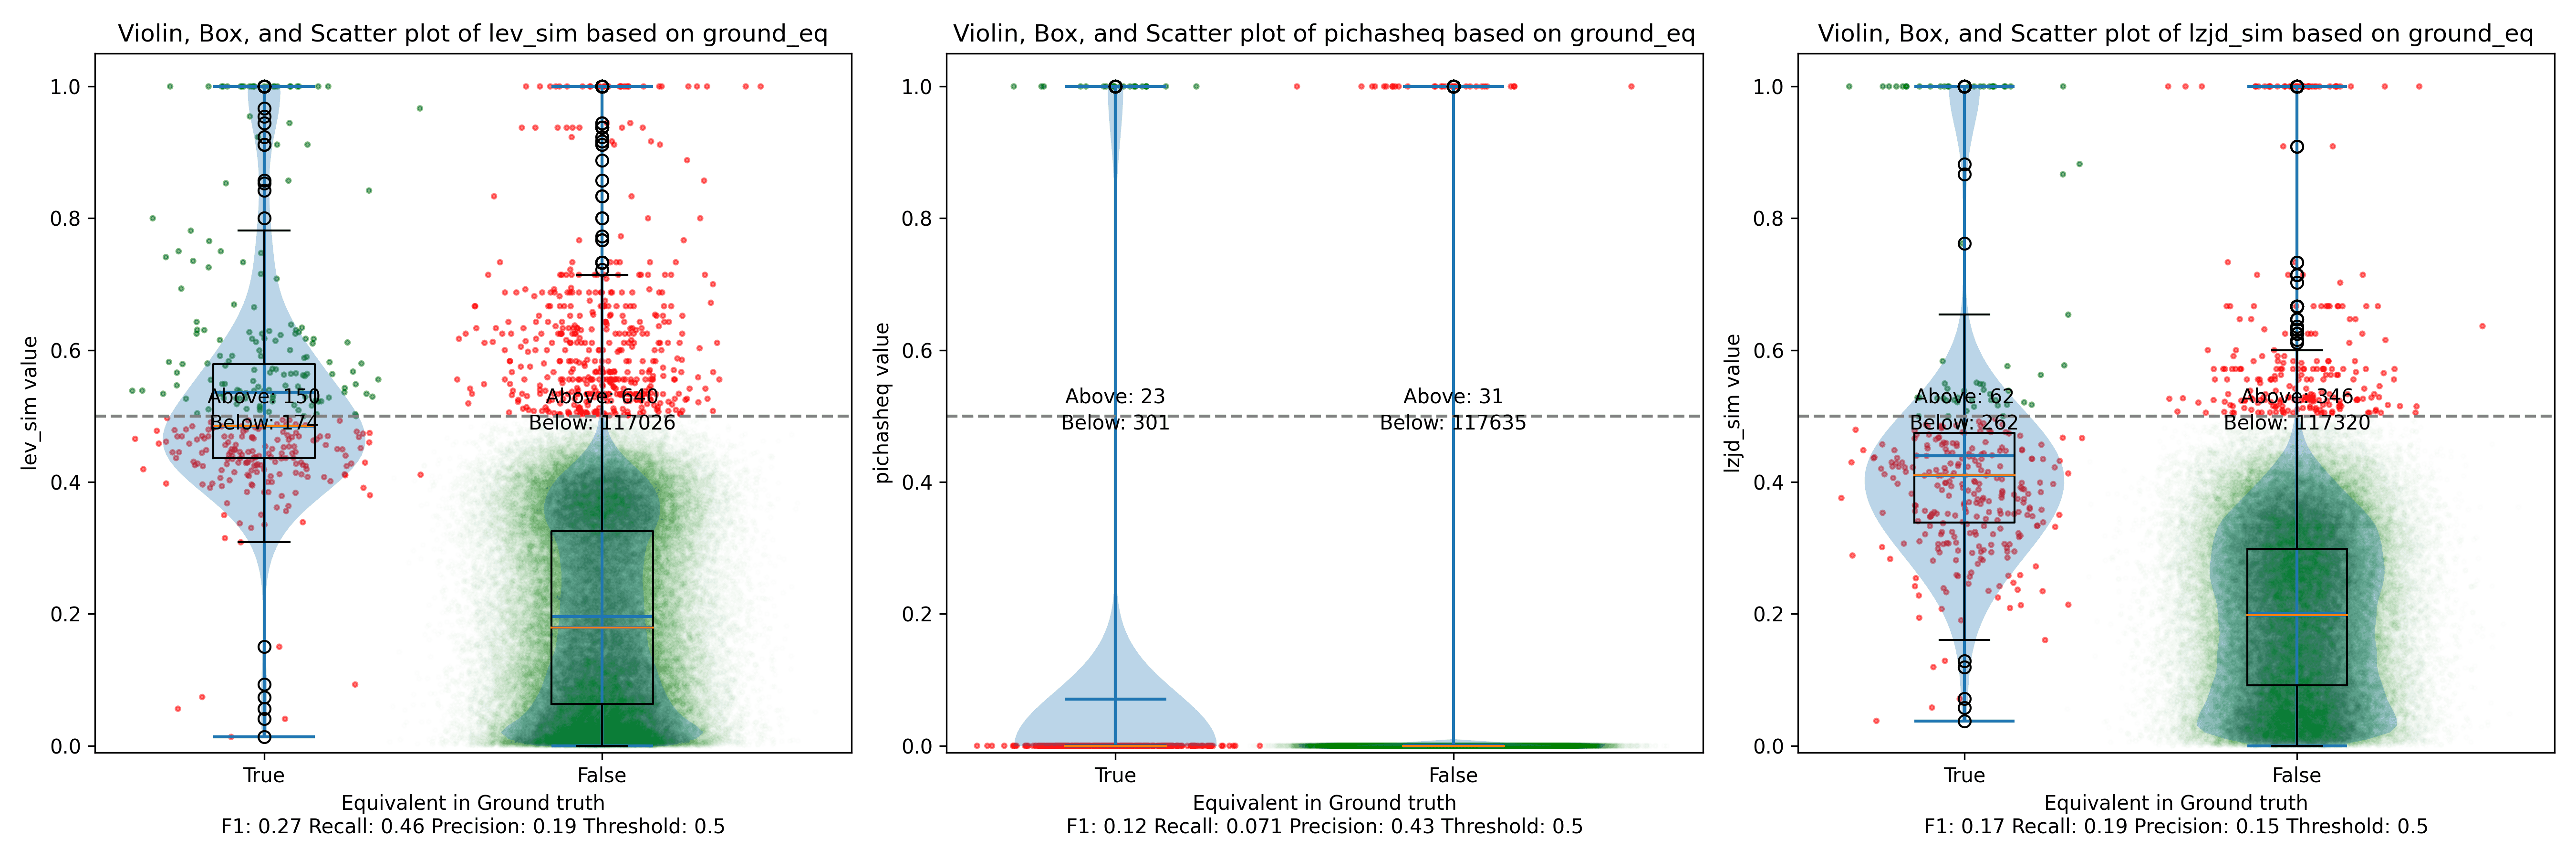
I like this visualization because it shows how well each similarity metric differentiates the similarity distributions of equivalent and non-equivalent function pairs. Obviously, the hallmark of a good similarity metric is that the distribution of equivalent functions should be higher than non-equivalent functions! Ideally, the similarity metric should produce distributions that do not overlap at all, so we could draw a line between them. In practice, the distributions usually intersect, and so instead we're forced to make a trade-off between precision and recall, as can be seen in the above Precision vs. Recall graph.
Overall, we can see from the violin plot that LEV and LZJD have a slightly
higher F1 score (reported at the bottom of the violin plot), but none of these
techniques are doing a great job. This implies that gcc and clang produce
code that is quite different syntactically.
Experiment 1b: openssl 1.1.1w Compiled With Different Optimization Levels
The next comparison I did was to compile openssl 1.1.1w with gcc -g and
optimization levels -O0, -O1, -O2, -O3.
-O0 and -O3
Let's start with one of the extremes, comparing -O0 and -O3:
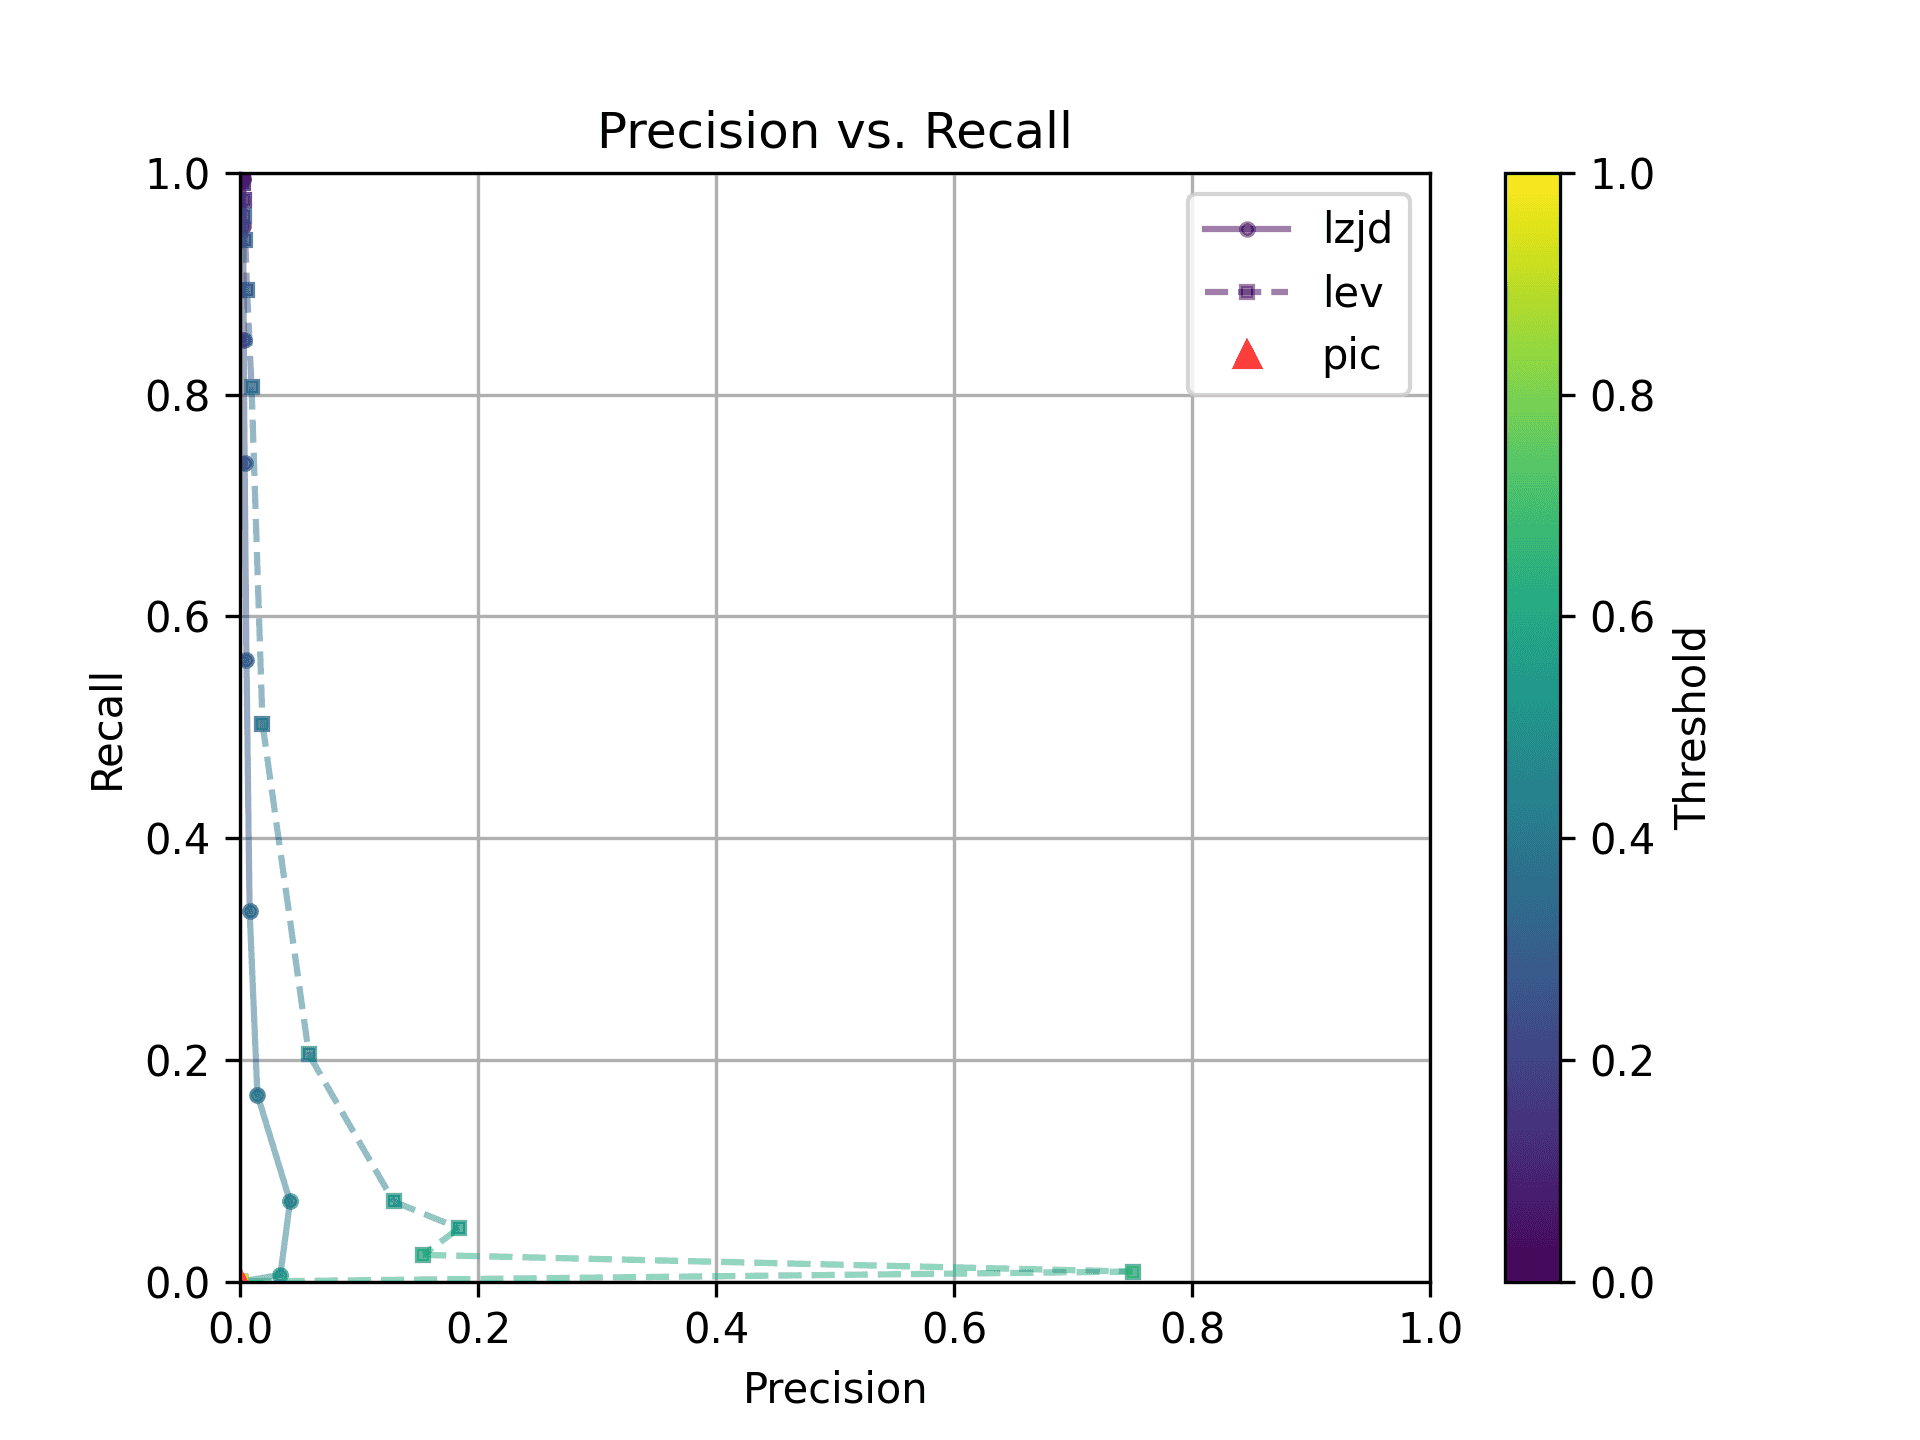
The first thing you might be wondering about in this graph is Where is PIC hashing? Well, it's there at (0, 0) if you look closely. The violin plot gives us a little more information about what is going on.
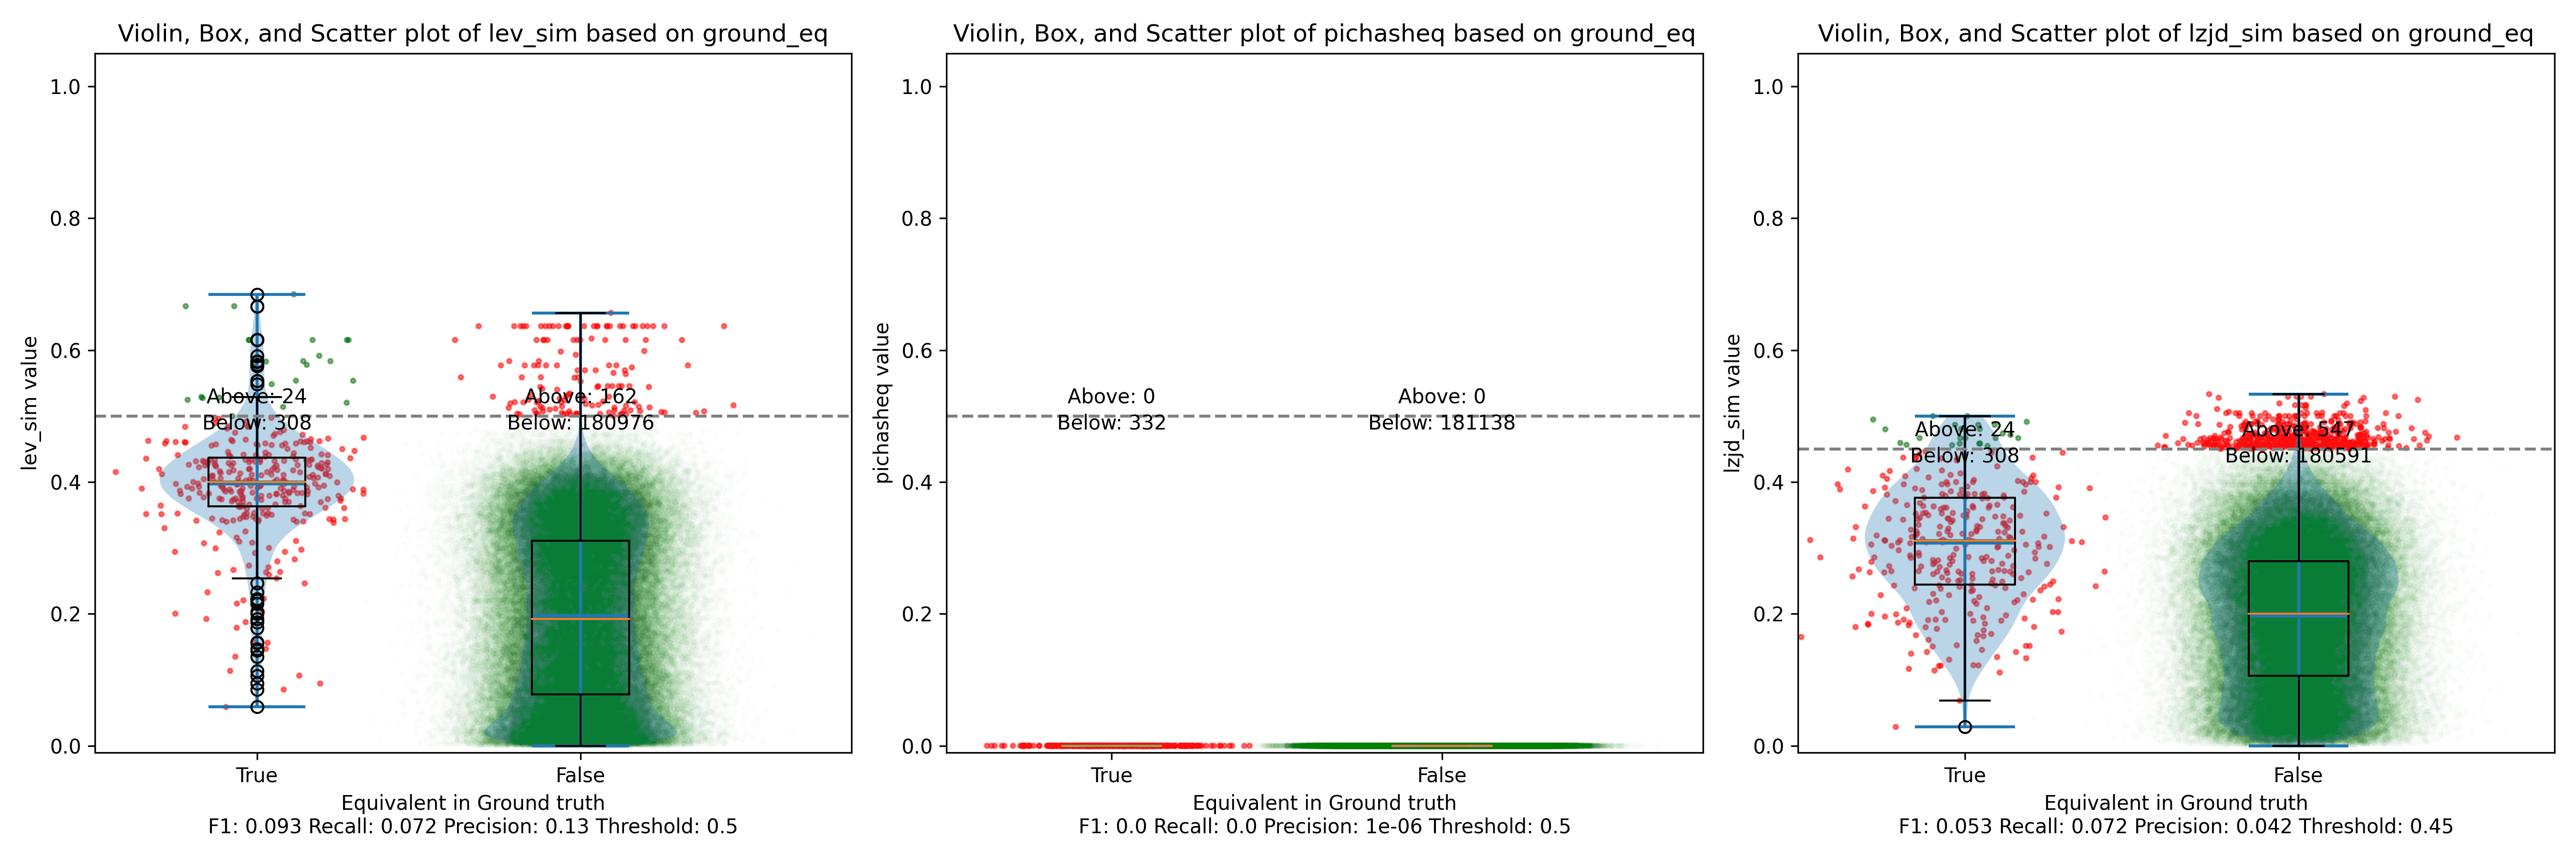
Here we can see that PIC hashing made no positive predictions. In other
words, none of the PIC hashes from the -O0 binary matched any of the PIC
hashes from the -O3 binary. I included this problem because I thought it
would be very challenging for PIC hashing, and I was right! But after some
discussion with Cory, we realized something fishy was going on. To achieve a
precision of 0.0, PIC hashing can't find any functions equivalent. That
includes trivially simple functions. If your function is just a ret
there's not much optimization to do.
Eventually, I guessed that the -O0 binary did not use the
-fomit-frame-pointer option, whereas all other optimization levels do. This
matters because this option changes the prologue and epilogue of every
function, which is why PIC hashing does so poorly here.
LEV and LZJD do slightly better again, achieving low (but non-zero) F1 scores. But to be fair, none of the techniques do very well here. It's a difficult problem.
-O2 and -O3
On the much easier extreme, let's look at -O2 and -O3.

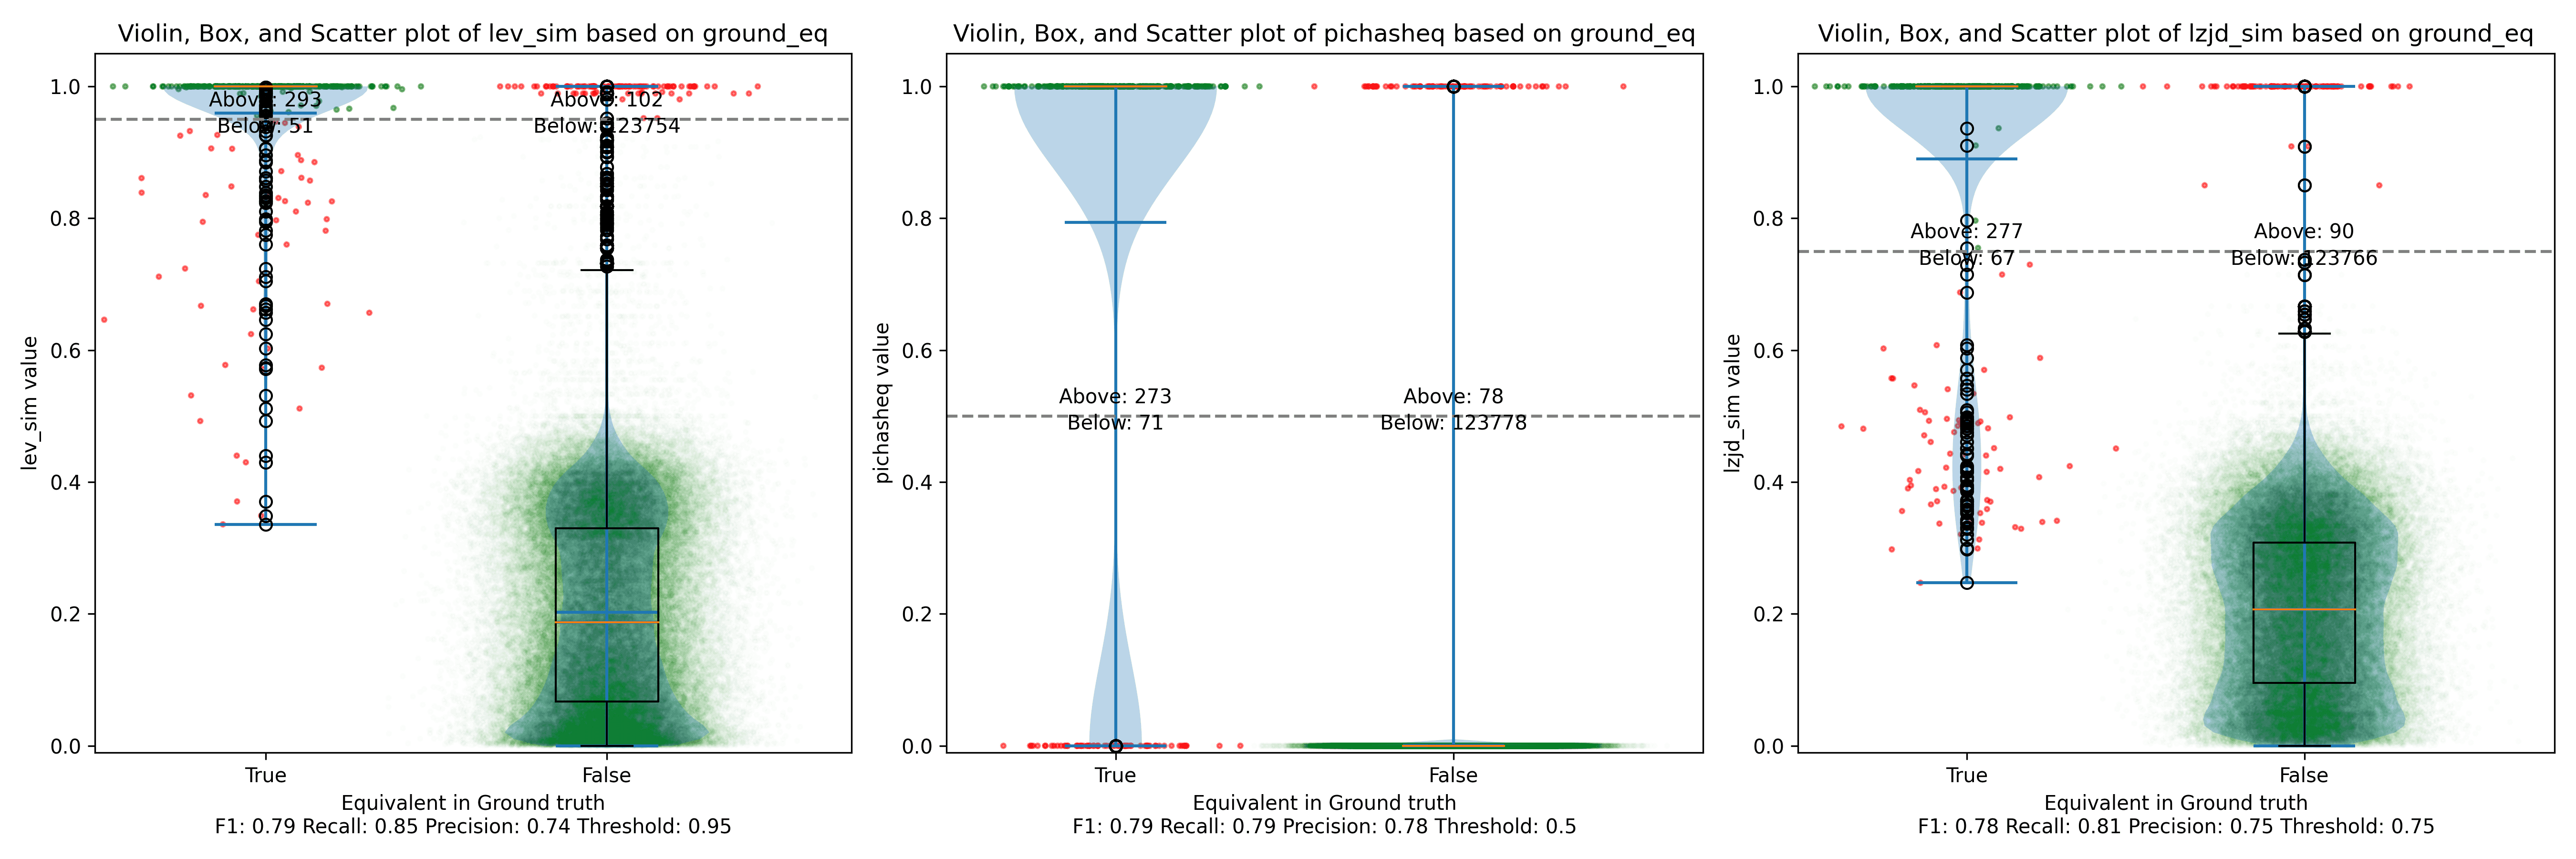
Nice! PIC hashing does pretty well here, achieving a recall of 0.79 and a precision of 0.78. LEV and LZJD do about the same. However, the Precision vs. Recall graph for LEV shows a much more appealing trade-off line. LZJD's trade-off line is not nearly as appealing, as it's more horizontal.
You can start to see more of a difference between the distributions in the violin plots here in the LEV and LZJD panels.
I'll call this one a tie.
-O1 and -O2
I would also expect -O1 and -O2 to be fairly similar, but not as similar as
-O2 and -O3. Let's see:

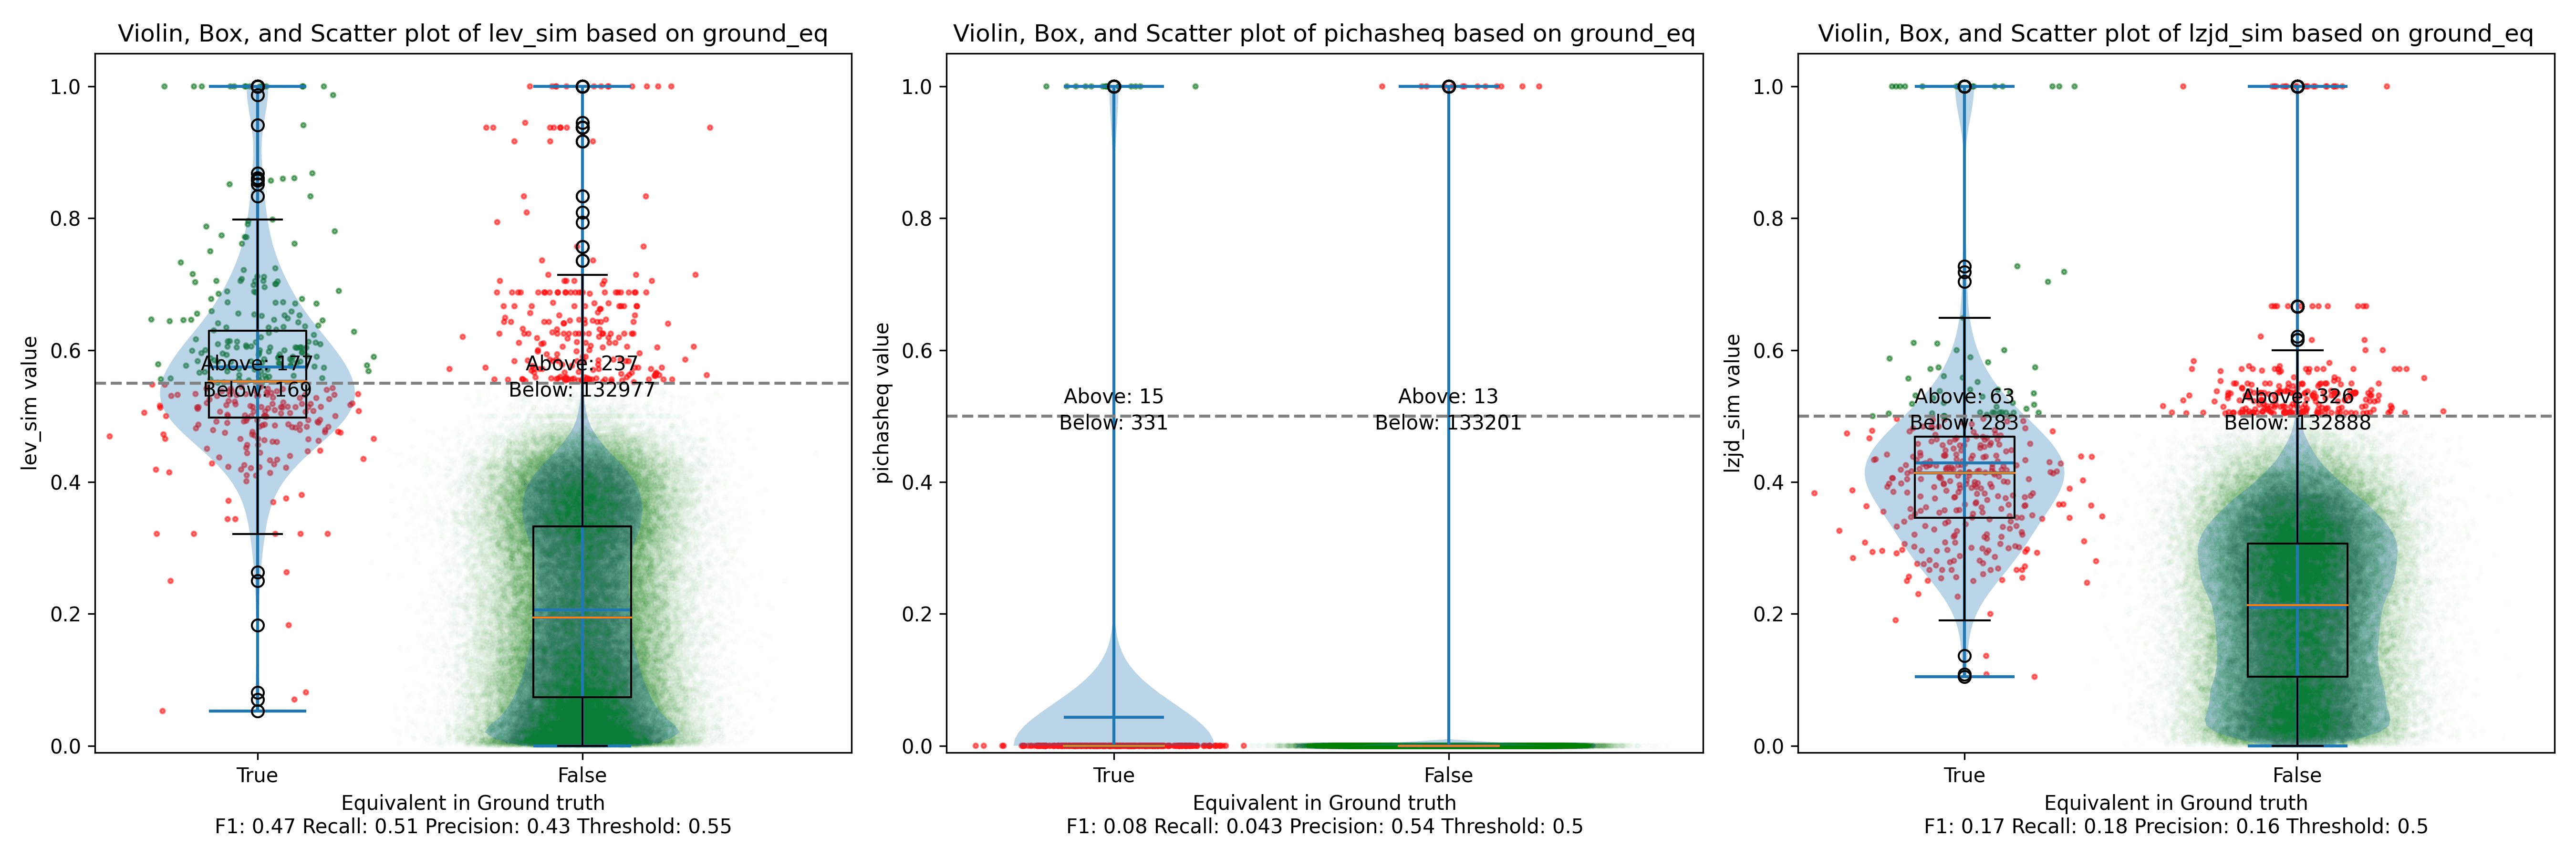
The Precision vs. Recall graph is very interesting. PIC hashing starts at a precision of 0.54 and a recall of 0.043. LEV in particular shoots straight up, indicating that by lowering the threshold, it is possible to increase recall substantially without losing much precision. A particularly attractive trade-off might be a precision of 0.43 and a recall of 0.51. This is the type of trade-off I was hoping for in fuzzy hashing.
Unfortunately, LZJD's trade-off line is again not nearly as appealing, as it curves in the wrong direction.
We'll say this is a pretty clear win for LEV.
-O1 and -O3
Finally, let's compare -O1 and -O3, which are different, but both have the
-fomit-frame-pointer option enabled by default.
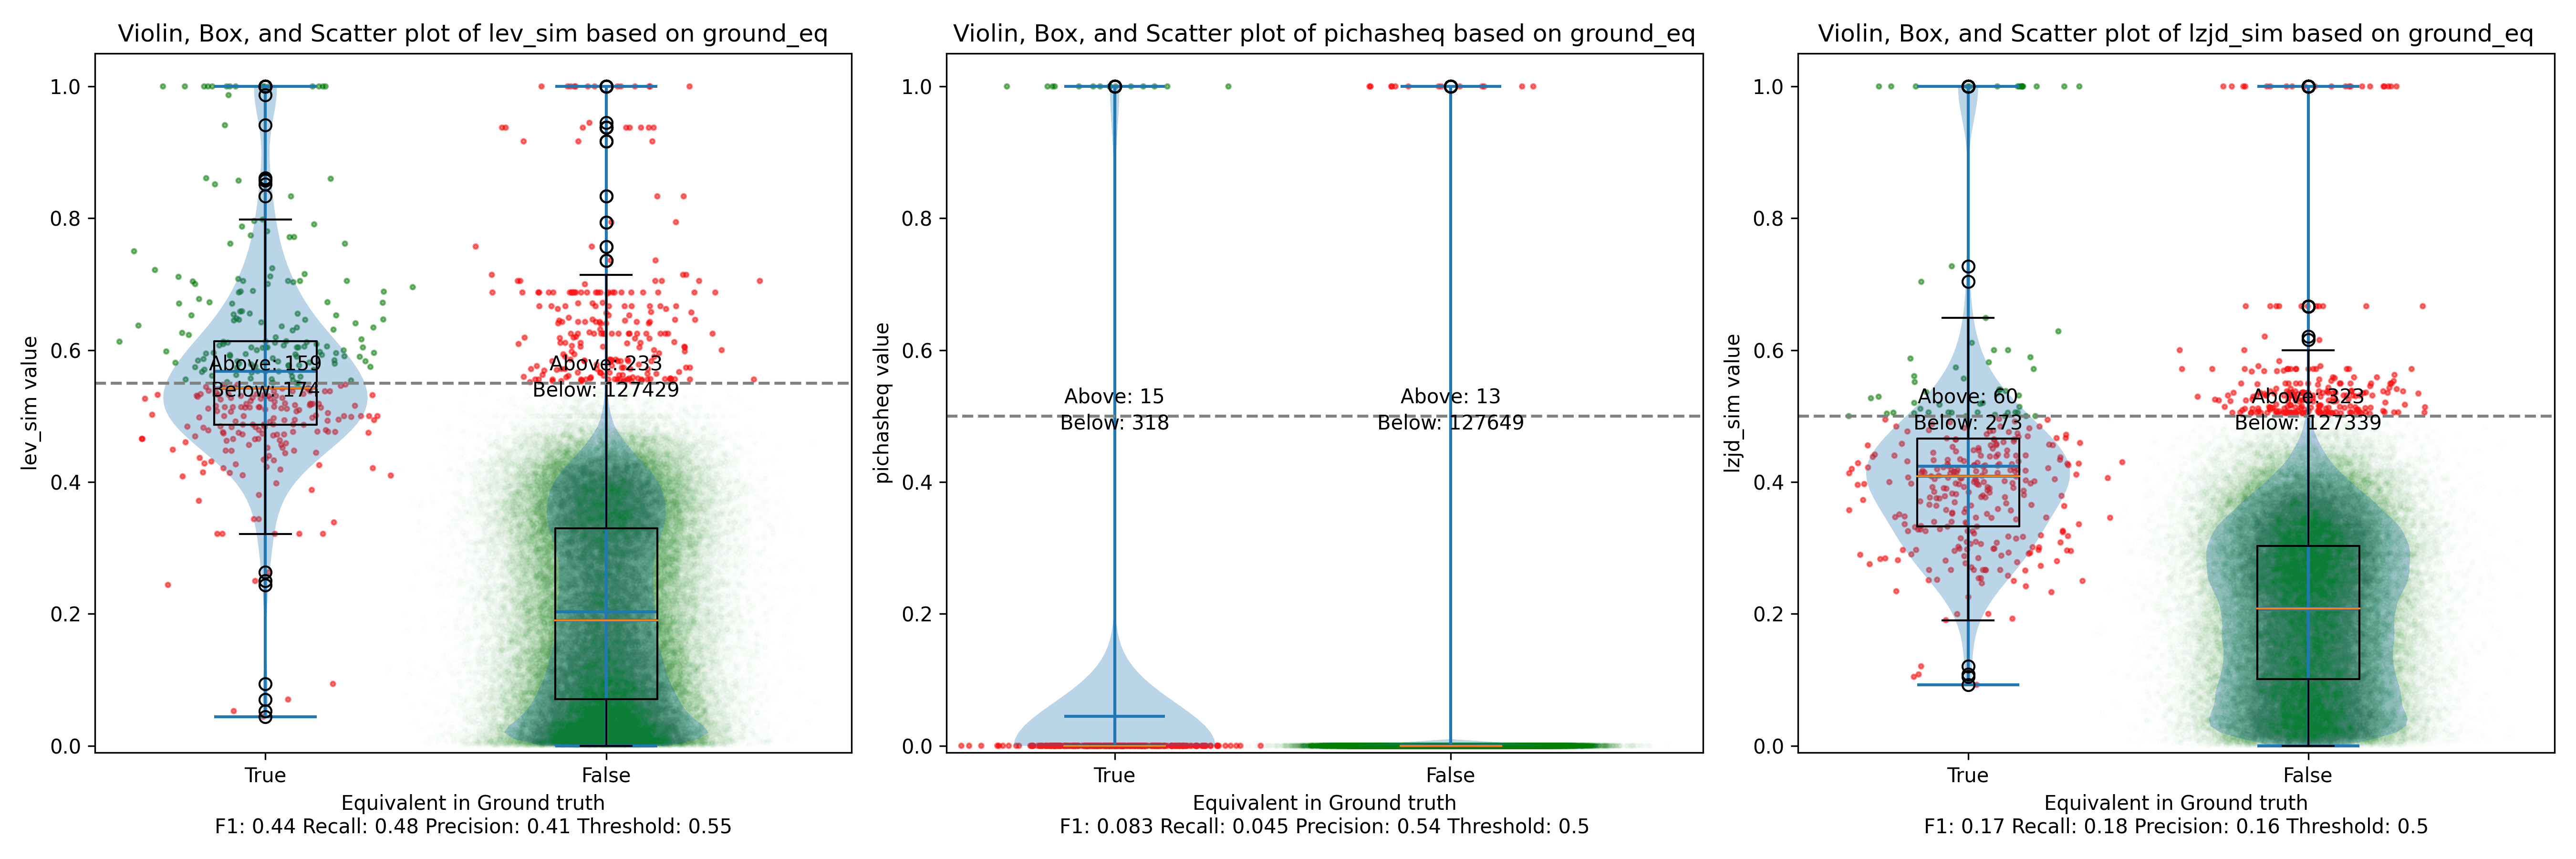
These graphs look almost identical to comparing -O1 and -O2; I guess the
difference between -O2 and -O3 is really pretty minor. So it's again a win for LEV.
Experiment 2: Different openssl Versions
The final experiment I did was to compare various versions of openssl. This experiment was suggested by Cory, who thought it was reflective of typical malware RE scenarios. The idea is that the malware author released Malware 1.0, which you RE. Later, the malware changes a few things and releases Malware 1.1, and you want to detect which functions did not change so that you can avoid REing them again.
We looked at a few different versions of openssl:
| Version | Release Date | Months In Between |
|---|---|---|
| 1.0.2u | Dec 20, 2019 | N/A |
| 1.1.1 | Sep 11, 2018 | N/A |
| 1.1.1q | Oct 12, 2022 | 49 |
| 1.1.1v | Aug 1, 2023 | 9 |
| 1.1.1w | Sep 11, 2023 | 1 |
For each version, I compiled them using gcc -g -O2.
openssl 1.0 and 1.1 are different minor versions of openssl. As explained here,
Letter releases, such as 1.0.2a, exclusively contain bug and security fixes and no new features.
So, we would expect that openssl 1.0.2u is fairly different than any 1.1.1 version. And we would expect that in the same minor version, 1.1.1 would be similar to 1.1.1q, but would be more different than 1.1.1w.
Experiment 2a: openssl 1.0.2u vs 1.1.1w
As before, let's start with the most extreme comparison: 1.0.2u vs 1.1.1w.
Perhaps not too surprisingly, because the two binaries are quite different, all three techniques struggle. We'll say this is a three way tie.
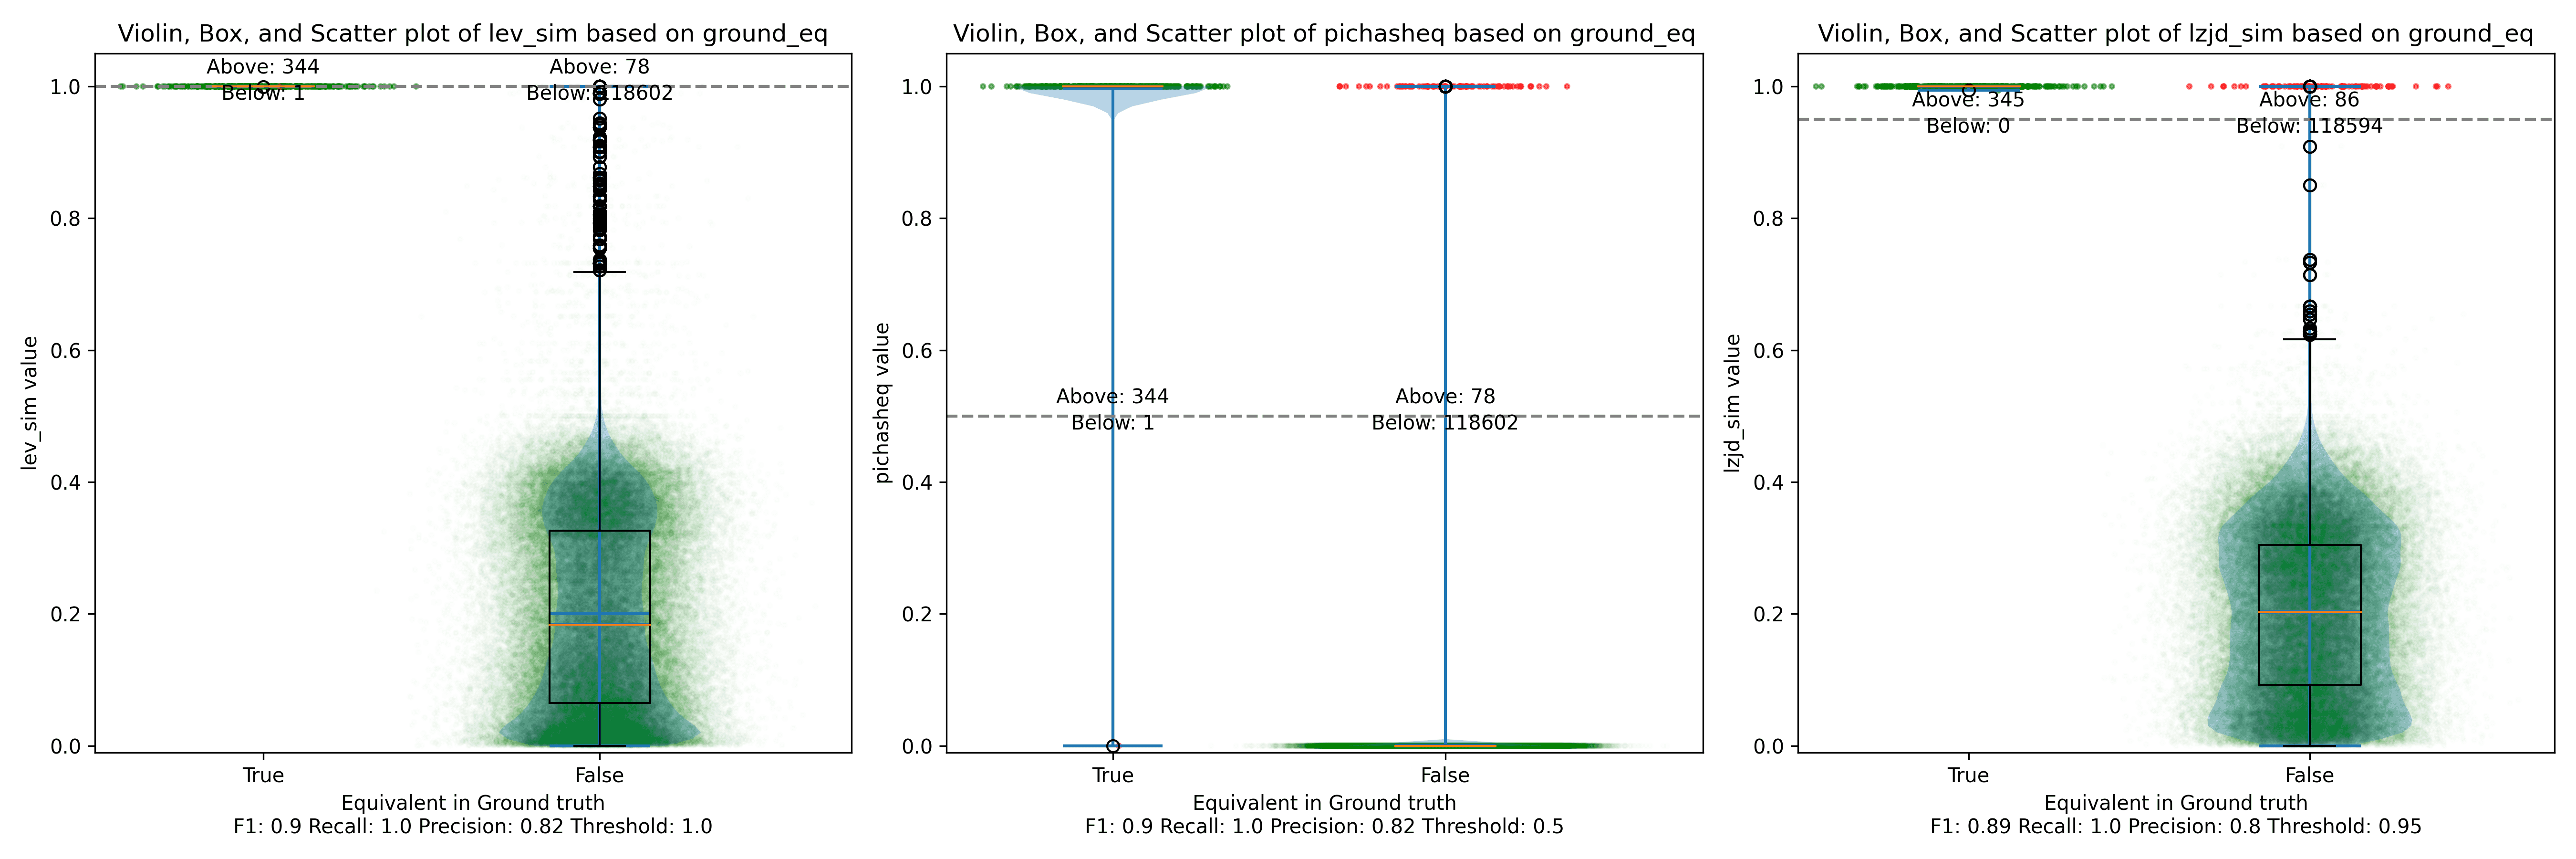
Experiment 2b: openssl 1.1.1 vs 1.1.1w
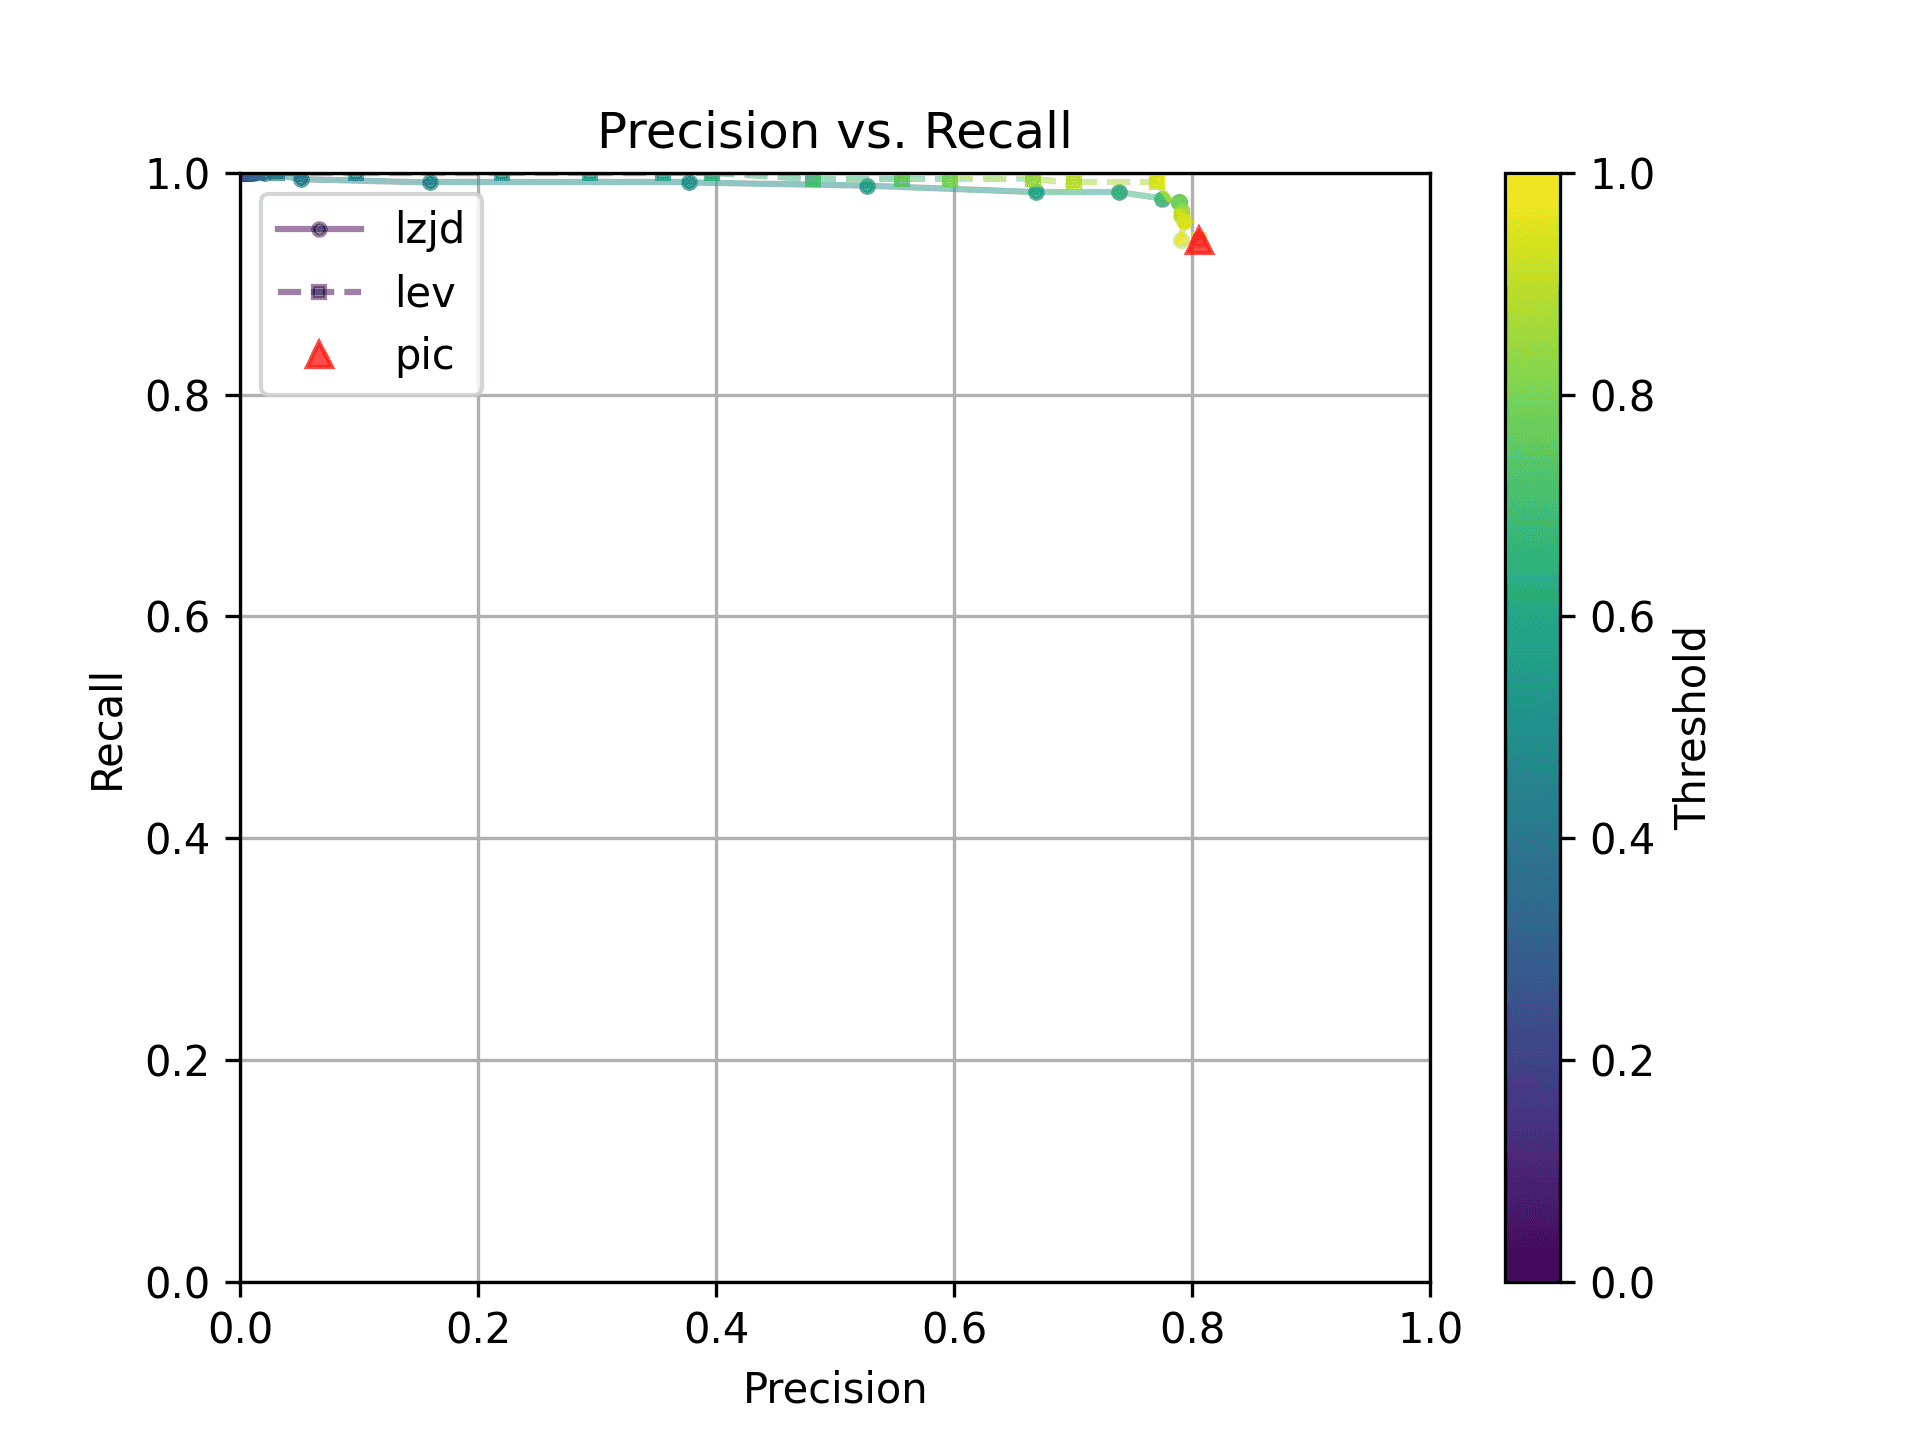
Now let's look at the original 1.1.1 release from September 2018, and compare to the 1.1.1w bugfix release from September 2023. Although a lot of time has passed between the releases, the only differences should be bug and security fixes.

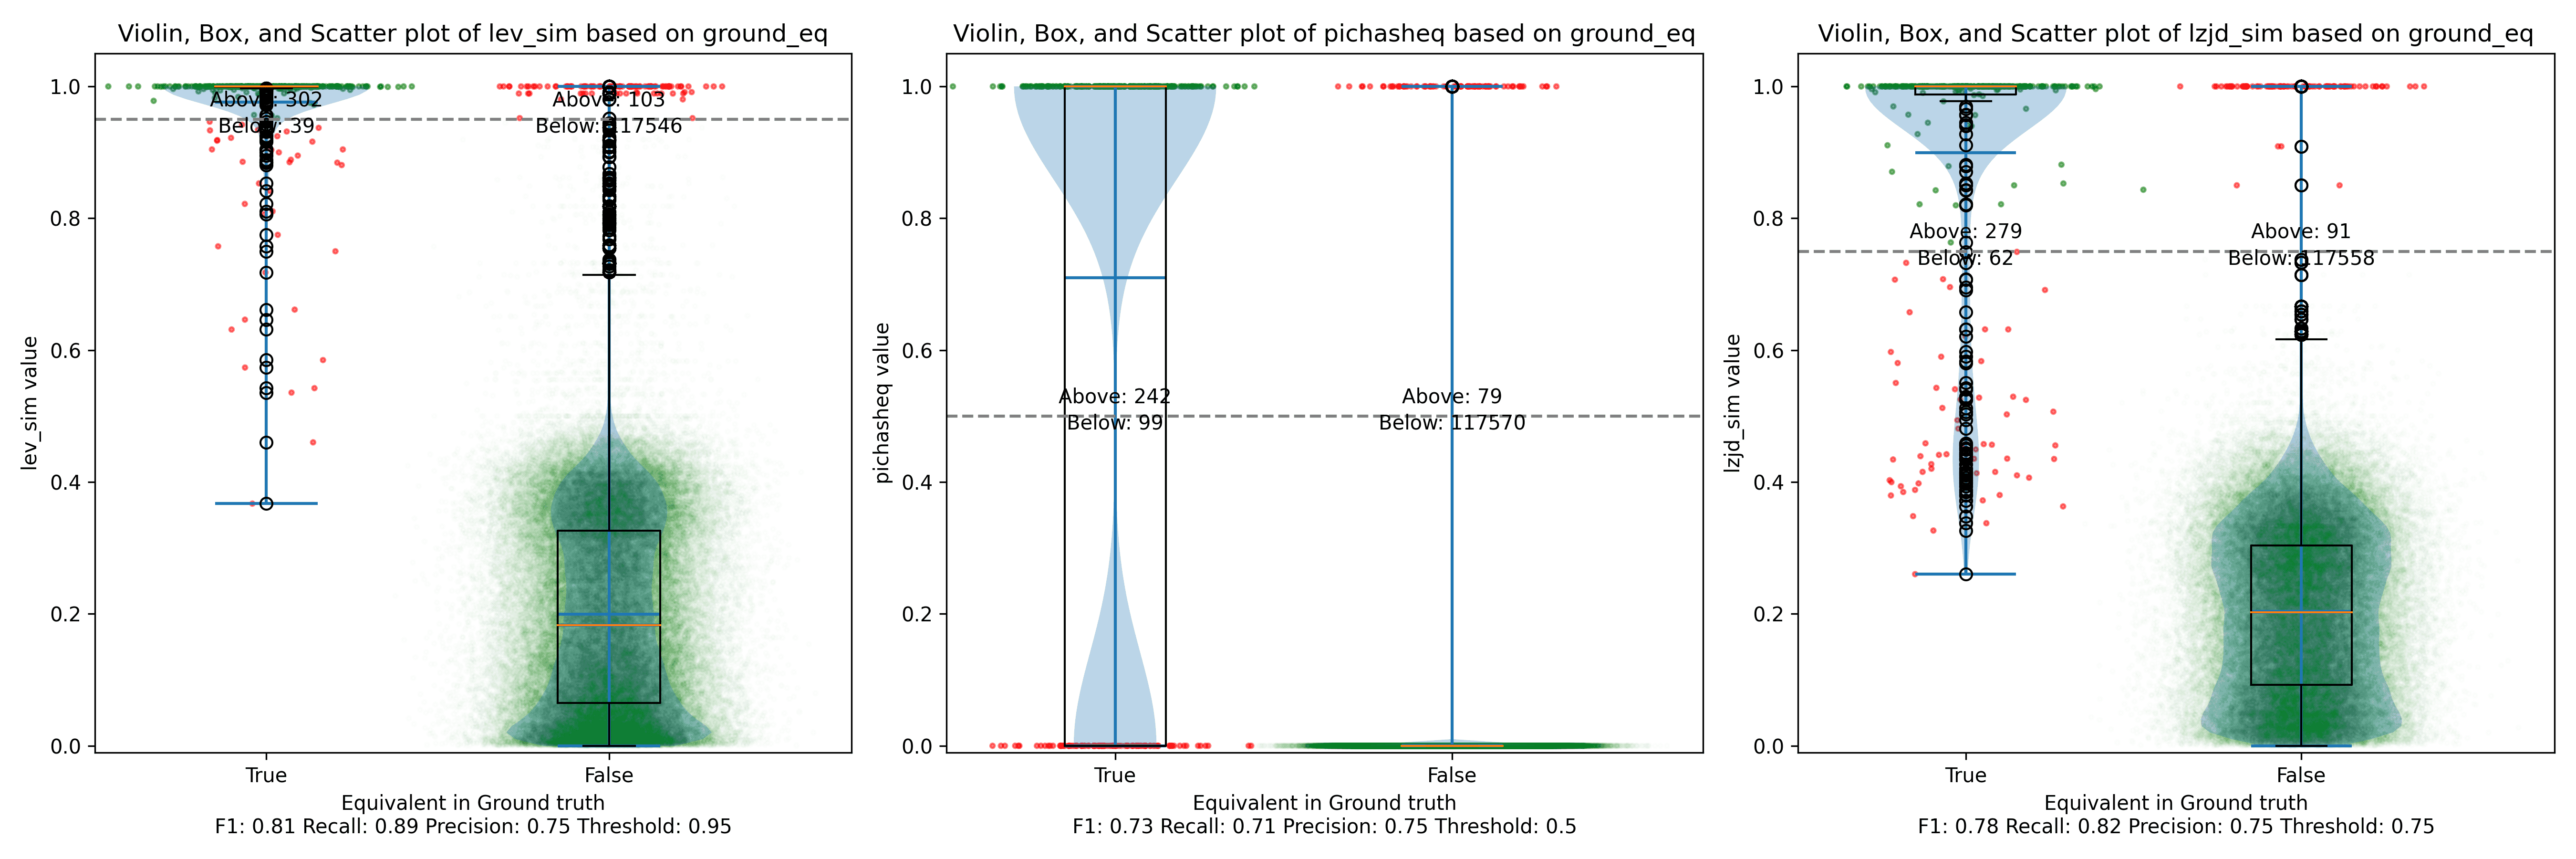
All three techniques do much better on this experiment, presumably because there are far fewer changes. PIC hashing achieves a precision of 0.75 and a recall of 0.71. LEV and LZJD go almost straight up, indicating an improvement in recall with minimal trade-off in precision. At roughly the same precision (0.75), LZJD achieves a recall of 0.82, and LEV improves it to 0.89.
LEV is the clear winner, with LZJD also showing a clear advantage over PIC.
Experiment 2c: openssl 1.1.1q vs 1.1.1w
Let's continue looking at more similar releases. Now we'll compare 1.1.1q from July 2022 to 1.1.1w from September 2023.
As can be seen in the Precision vs. Recall graph, PIC hashing starts at an impressive precision of 0.81 and a recall of 0.94. There simply isn't a lot of room for LZJD or LEV to make an improvement.
This is a three way tie.
Experiment 2d: openssl 1.1.1v vs 1.1.1w
Finally, we'll look at 1.1.1v and 1.1.1w, which were released only a month apart.
Unsurprisingly, PIC hashing does even better here, with a precision of 0.82 and a recall of 1.0 (after rounding)! Again, there's basically no room for LZJD or LEV to improve.
This is another three way tie.
Conclusion
Thresholds in Practice
We saw some scenarios where LEV and LZJD outperformed PIC hashing. But it's important to realize that we are conducting these experiments with ground truth, and we're using the ground truth to select the optimal threshold. You can see these thresholds listed at the bottom of each violin plot. Unfortunately, if you look carefully, you'll also notice that the optimal thresholds are not always the same. For example, the optimal threshold for LZJD in the "openssl 1.0.2u vs 1.1.1w" experiment was 0.95, but it was 0.75 in the "openssl 1.1.1q vs 1.1.1w" experiment.
In the real world, to use LZJD or LEV, you need to select a threshold. Unlike in these experiments, you could not select the optimal one, because you would have no way of knowing if your threshold was working well or not! If you choose a poor threshold, you might get substantially worse results than PIC hashing!
PIC Hashing is Pretty Good
I think we learned that PIC hashing is pretty good. It's not perfect, but it generally provides excellent precision. In theory, LZJD and LEV can perform better in terms of recall, which is nice, but in practice, it's not clear that they would because you would not know which threshold to use.
And although we didn't talk much about performance, PIC hashing is very fast. Although LZJD is much faster than LEV, it's still not nearly as fast as PIC.
Imagine you have a database of a million malware function samples, and you have a function that you want to look up in the database. For PIC hashing, this is just a standard database lookup, which can benefit from indexes and other precomputation techniques. For fuzzy hash approaches, we would need to invoke the similarity function a million times each time we wanted to do a database lookup.
There's a Limit to Syntactic Similarity
Remember that we used LEV to represent the optimal similarity based on the edit distance of instruction bytes. That LEV did not blow PIC out of the water is very telling, and suggests that there is a fundamental limit to how well syntactic similarity based on instruction bytes can perform. And surprisingly to me, PIC hashing appears to be pretty close to that limit. We saw a striking example of this limit when the frame pointer was accidentally omitted, and more generally, all syntactic techniques struggle when the differences become too great.
I wonder if any variants, like computing similarities over assembly code instead of executable code bytes, would perform any better.
Where Do We Go From Here?
There are of course other strategies for comparing similarity, such as incorporating semantic information. Many researchers have studied this. The general downside to semantic techniques is that they are substantially more expensive than syntactic techniques. But if you're willing to pay the price, you can get better results. Maybe in a future blog post we'll try one of these techniques out, such as the one my contemporary and friend Wesley Jin proposed in his dissertation.
While I was writing this blog post, Ghidra 11.0 also introduced BSim:
A major new feature called BSim has been added. BSim can find structurally similar functions in (potentially large) collections of binaries or object files. BSim is based on Ghidra's decompiler and can find matches across compilers used, architectures, and/or small changes to source code.
Another interesting question is whether we can use neural learning to help compute similarity. For example, we might be able to train a model to understand that omitting the frame pointer does not change the meaning of a function, and so shouldn't be counted as a difference.
Hello, Merry Christmas and Happy Holidays! I just completed Advent of Code 2023, and wanted to jot down a few reflections before I disappear for the holidays. Like last year, I chose to implement my solutions using Rust.
Rust: easier with practice, but still a bit in the way
The good news is that I ran into far fewer problems with Rust this year. There
are a few reasons for this, but a lot of it just boils down to experience. I
tend to program excessively using lazy iterators, and I began to get a second
sense for when I'd need to call .collect() to avoid referencing a freed
temporary value. Similarly, when I would get a compiler error (and yes, this
still happens a lot!), I would often immediately know how to fix the problem.
That being said, there were still occasions when the language just "got in the
way". I had a few solutions where I had to throw in copious amounts of
.clone() calls. One salient example was on day
22
when I wanted to memoize a subproblem. But to do so, I also had to pass a value
instead of a reference to each sub-problem, which slowed things down
dramatically. Anyway, with more work, the solution probably would have been to
use references with lifetimes and just ensure that memoization happened during
the right lifetimes. But the key phrase there is with more work. And see
below
-- I was already pretty frustrated.
Chat-GPT and Co-pilot
On this year's Advent of Code, I used Chat-GPT and Co-pilot quite heavily, as I do in practice when coding. I used Chat-GPT mostly to avoid looking up documentation or crates. For example, "How can I add a progress indicator to an iterator in Rust?" or "How can I bind a sub-pattern to a name in Rust?". Given that I hadn't programmed in Rust for a year, I was a bit rusty (ha!)
Co-pilot was also quite useful. It was pretty good at writing out boilerplate code. Advent of Code problems tend to include copious amounts of grid problems, and Co-pilot reduced a lot of the fatigue for helper functions. Define things for the X axis, and it would figure out how to implement the other cases.
I also found that Co-pilot was able to explain weird Rust borrowing problems far
better than the compiler. As I wrote about last year, Rust's borrowing rules
sometimes don't work that great for my programming style, but Co-pilot was
pretty good about explaining problems. I don't have a specific example, but
think of searching a vector using vec.iter(), using the found value at some
point, and then later trying to move the vector. In my opinion, this definitely
makes it easier to program in Rust.
Now, Co-pilot did introduce some headaches as well. Although it was pretty
good, it would sometimes introduce problematic completions. For instance, it
really liked to complete print statements by adding an extra quote, e.g.,
println!("This is something: {:?}", something"); Not a huge deal, but it
happened enough that it was irritating.
Frustration and Clear-headedness: The Fine Line Between Perseverance and Stubbornness
On some level, I think everyone knows this, but it's still worth saying: You are more effective when thinking clearly. I recall from graduate school that many of my fellow students would pull all nighters and submit papers in the wee hours of the morning. I never did that. My efficiency just plummets as I get tired.
I experienced a pretty funny (in retrospect) example of this on day 22. You can read the problem, it's not really that hard. One of the nice things about programming functionally is that it usually works or completely fails. There's not a lot of in-between. In Advent of Code, this means that if your solution works on the example, it usually works on the real input (ignoring performance). But on day 22, my code did not work on the real input. The problem is pretty simple, so it was infuriating. Rather than taking a break to clear my head, I just kept trying to debug it. I stayed up far past my bed time, becoming more and more frustrated. I even completely rewrote my implementation in Python before giving up and going to bed.
The next morning, I woke up and looked at the problem again. I had a simple idea. I actually had two solutions to the problem. I had a simple but slow solution that I was confident was correct, but was too slow to use on the real input. And I had my fast solution that I thought should be correct, but wasn't. My insight was that I could make "in between" problems by just taking a portion of the real input -- say 10%. And then see if my fast solution agreed with the slow one. It didn't. I then ran Lithium and reduced the input to a minimal example. From here, it was trivial to spot the fundamental problem I had in my recursive algorithm. I fixed it, and my solution worked. This whole process probably only took 30 minutes from the time I woke up. I futilely spent hours the previous night. And the worst part is that, even in the moment, I knew I was acting foolishly. I was just too frustrated to stop.
I don't know if this is universal, but when I am stressed or frustrated, I usually make mistakes, which naturally compound my stress and frustration! There is a fine line between perseverance and stubbornness, and I crossed it on day 22.
I've been working on a blog post that has some interesting images in it. Unfortunately, my blog view is narrow, which makes it hard to see these. So, I decided to add a "click for full screen" feature to my blog. How hard could it be?
Answer: Very hard. Sadly, this took me a few days.
I hope to write a more detailed post about this later, but for now, I wanted to show off the fruits of my labor.
I can write:
<fsclick></fsclick>And you see:

Go ahead, click on it, I dare you! src
I'm trying to document a few things that I do infrequently enough that I tend to forget how to do them, and need to rediscover the process each time. Next in this series is debugging the Ghidra decompiler. This is one of the only resources I know of that discusses this!
The process is roughly:
cd /path/to/ghidra/Ghidra/Features/Decompiler/src/decompile/cppmake decomp_dbg-
Inside of Ghidra, right click on the "Debug Function Decompilation" menu item and save the XML file somewhere.
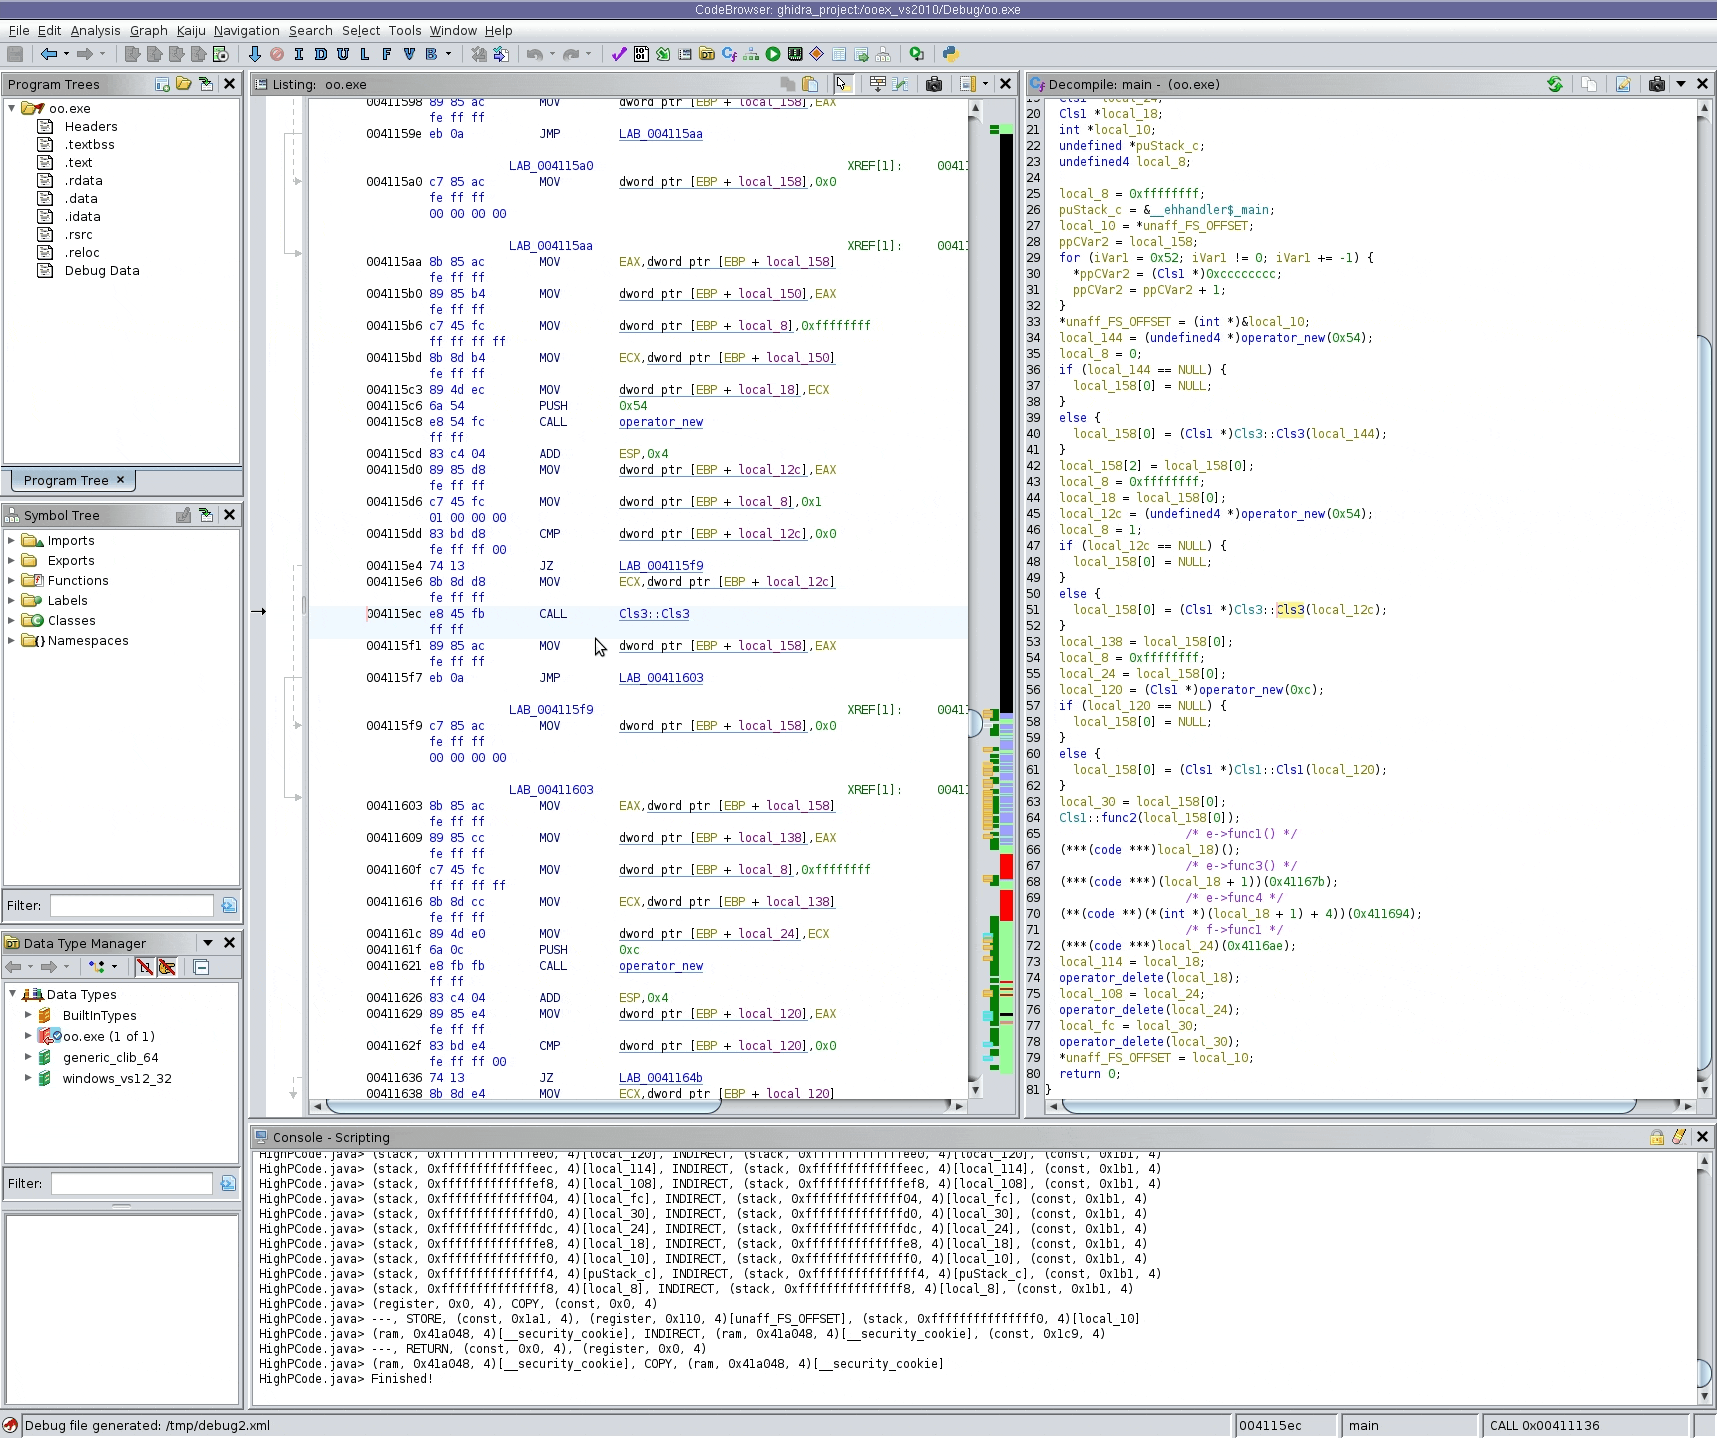
- Run
SLEIGHHOME=/path/to/ghidra ./decomp_dbg. You should now be in thedecomp_dbginterpreter. - Use
restore /path/to/debug.xml - Use
load function target_func - Optionally use
trace address insn_address - Finally run
decompile
Here's a full example:
~/g/g/G/F/D/s/d/cpp $ env SLEIGHHOME=/home/ed/ghidra/ghidra_10.4_PUBLIC/ ./decomp_dbg
[decomp]> restore /tmp/mydebug.xml
/tmp/mydebug.xml successfully loaded: Intel/AMD 32-bit x86
[decomp]> load function main
Function main: 0x00411530
[decomp]> trace address 0x4115ec
OK (1 ranges)
[decomp]> decompile
Decompiling main
DEBUG 0: extrapopsetup
0x004115ec:200: **
   0x004115ec:200: ESP(0x004115ec:200) = ESP(free) + #0x4

DEBUG 1: funclink
0x004115ec:a5: call fCls3:8(free)
   0x004115ec:a5: EAX(0x004115ec:a5) = call fCls3:8(free)(ECX(free),u0x10000019:1(0x004115ec:212))
0x004115ec:211: **
   0x004115ec:211: u0x10000015(0x004115ec:211) = ESP(free) + #0x0
0x004115ec:212: **
   0x004115ec:212: u0x10000019:1(0x004115ec:212) = *(ram,u0x10000015(0x004115ec:211))

DEBUG 2: heritage
0x004115ec:248: **
   0x004115ec:248: ECX(0x004115ec:248) = [create] i0x004115ec:a5:8(free)
0x004115ec:25a: **
   0x004115ec:25a: EDX(0x004115ec:25a) = [create] i0x004115ec:a5:8(free)
0x004115ec:26f: **
   0x004115ec:26f: CF(0x004115ec:26f) = CF(0x004115dd:96) [] i0x004115ec:a5:8(free)
0x004115ec:280: **
   0x004115ec:280: PF(0x004115ec:280) = PF(0x004115dd:9e) [] i0x004115ec:a5:8(free)
0x004115ec:291: **
   0x004115ec:291: ZF(0x004115ec:291) = ZF(0x004115dd:9a) [] i0x004115ec:a5:8(free)
0x004115ec:2a2: **
   0x004115ec:2a2: SF(0x004115ec:2a2) = SF(0x004115dd:99) [] i0x004115ec:a5:8(free)
0x004115ec:2b3: **
   0x004115ec:2b3: OF(0x004115ec:2b3) = OF(0x004115dd:97) [] i0x004115ec:a5:8(free)
0x004115ec:2c4: **
   0x004115ec:2c4: EIP(0x004115ec:2c4) = EIP(0x004115c8:2c3) [] i0x004115ec:a5:8(free)
0x004115ec:a3: ESP(0x004115ec:a3) = ESP(free) - #0x4
   0x004115ec:a3: ESP(0x004115ec:a3) = ESP(0x004115cd:86) - #0x4
0x004115ec:a4: *(ram,ESP(free)) = #0x4115f1
   0x004115ec:a4: *(ram,ESP(0x004115ec:a3)) = #0x4115f1
0x004115ec:211: u0x10000015(0x004115ec:211) = ESP(free) + #0x0
   0x004115ec:211: u0x10000015(0x004115ec:211) = ESP(0x004115ec:a3) + #0x0
0x004115ec:a5: EAX(0x004115ec:a5) = call fCls3:8(free)(ECX(free),u0x10000019:1(0x004115ec:212))
   0x004115ec:a5: EAX(0x004115ec:a5) = call fCls3:8(free)(ECX(0x004115e6:a2),u0x10000019:1(0x004115ec:212))
0x004115ec:200: ESP(0x004115ec:200) = ESP(free) + #0x4
   0x004115ec:200: ESP(0x004115ec:200) = ESP(0x004115ec:a3) + #0x4

DEBUG 3: deadcode
0x004115ec:248: ECX(0x004115ec:248) = [create] i0x004115ec:a5:8(free)
   0x004115ec:248: **
0x004115ec:25a: EDX(0x004115ec:25a) = [create] i0x004115ec:a5:8(free)
   0x004115ec:25a: **
0x004115ec:26f: CF(0x004115ec:26f) = CF(0x004115dd:96) [] i0x004115ec:a5:8(free)
   0x004115ec:26f: **
0x004115ec:280: PF(0x004115ec:280) = PF(0x004115dd:9e) [] i0x004115ec:a5:8(free)
   0x004115ec:280: **
0x004115ec:291: ZF(0x004115ec:291) = ZF(0x004115dd:9a) [] i0x004115ec:a5:8(free)
   0x004115ec:291: **
0x004115ec:2a2: SF(0x004115ec:2a2) = SF(0x004115dd:99) [] i0x004115ec:a5:8(free)
   0x004115ec:2a2: **
0x004115ec:2b3: OF(0x004115ec:2b3) = OF(0x004115dd:97) [] i0x004115ec:a5:8(free)
   0x004115ec:2b3: **
0x004115ec:2c4: EIP(0x004115ec:2c4) = EIP(0x004115c8:2c3) [] i0x004115ec:a5:8(free)
   0x004115ec:2c4: **

DEBUG 4: sub2add
0x004115ec:2e4: **
   0x004115ec:2e4: u0x100000a0(0x004115ec:2e4) = #0x4 * #0xffffffff
0x004115ec:a3: ESP(0x004115ec:a3) = ESP(0x004115cd:86) - #0x4
   0x004115ec:a3: ESP(0x004115ec:a3) = ESP(0x004115cd:86) + u0x100000a0(0x004115ec:2e4)

DEBUG 5: propagatecopy
0x004115ec:a5: EAX(0x004115ec:a5) = call fCls3:8(free)(ECX(0x004115e6:a2),u0x10000019:1(0x004115ec:212))
   0x004115ec:a5: EAX(0x004115ec:a5) = call fCls3:8(free)(u0x00007a80(0x004115e6:a1),u0x10000019:1(0x004115ec:212))

DEBUG 6: identityel
0x004115ec:211: u0x10000015(0x004115ec:211) = ESP(0x004115ec:a3) + #0x0
   0x004115ec:211: u0x10000015(0x004115ec:211) = ESP(0x004115ec:a3)

DEBUG 7: propagatecopy
0x004115ec:212: u0x10000019:1(0x004115ec:212) = *(ram,u0x10000015(0x004115ec:211))
   0x004115ec:212: u0x10000019:1(0x004115ec:212) = *(ram,ESP(0x004115ec:a3))

DEBUG 8: collapseconstants
0x004115ec:2e4: u0x100000a0(0x004115ec:2e4) = #0x4 * #0xffffffff
   0x004115ec:2e4: u0x100000a0(0x004115ec:2e4) = #0xfffffffc

DEBUG 9: propagatecopy
0x004115ec:a3: ESP(0x004115ec:a3) = ESP(0x004115cd:86) + u0x100000a0(0x004115ec:2e4)
   0x004115ec:a3: ESP(0x004115ec:a3) = ESP(0x004115cd:86) + #0xfffffffc

DEBUG 10: addmultcollapse
0x004115ec:200: ESP(0x004115ec:200) = ESP(0x004115ec:a3) + #0x4
   0x004115ec:200: ESP(0x004115ec:200) = ESP(0x004115cd:86) + #0x0

DEBUG 11: earlyremoval
0x004115ec:211: u0x10000015(0x004115ec:211) = ESP(0x004115ec:a3)
   0x004115ec:211: **

DEBUG 12: earlyremoval
0x004115ec:2e4: u0x100000a0(0x004115ec:2e4) = #0xfffffffc
   0x004115ec:2e4: **

DEBUG 13: addmultcollapse
0x004115ec:a3: ESP(0x004115ec:a3) = ESP(0x004115cd:86) + #0xfffffffc
   0x004115ec:a3: ESP(0x004115ec:a3) = ESP(0x004115aa:26a) + #0xfffffffc

DEBUG 14: identityel
0x004115ec:200: ESP(0x004115ec:200) = ESP(0x004115cd:86) + #0x0
   0x004115ec:200: ESP(0x004115ec:200) = ESP(0x004115cd:86)

DEBUG 15: multicollapse
0x004115ec:a3: ESP(0x004115ec:a3) = ESP(0x004115aa:26a) + #0xfffffffc
   0x004115ec:a3: ESP(0x004115ec:a3) = ESP(0x00411574:4b) + #0xfffffffc

DEBUG 16: addmultcollapse
0x004115ec:a3: ESP(0x004115ec:a3) = ESP(0x00411574:4b) + #0xfffffffc
   0x004115ec:a3: ESP(0x004115ec:a3) = ESP(i) + #0xfffffe94

DEBUG 17: earlyremoval
0x004115ec:200: ESP(0x004115ec:200) = ESP(0x004115cd:86)
   0x004115ec:200: **

DEBUG 18: stackptrflow
0x004115ec:a3: ESP(0x004115ec:a3) = ESP(i) + #0xfffffe94
   0x004115ec:a3: ESP(0x004115ec:a3) = ESP(i) + #0xfffffe94

DEBUG 19: storevarnode
0x004115ec:a4: *(ram,ESP(0x004115ec:a3)) = #0x4115f1
   0x004115ec:a4: s0xfffffe94(0x004115ec:a4) = #0x4115f1

DEBUG 20: loadvarnode
0x004115ec:212: u0x10000019:1(0x004115ec:212) = *(ram,ESP(0x004115ec:a3))
   0x004115ec:212: **
0x004115ec:a5: EAX(0x004115ec:a5) = call fCls3:8(free)(u0x00007a80(0x004115e6:a1),u0x10000019:1(0x004115ec:212))
   0x004115ec:a5: EAX(0x004115ec:a5) = call fCls3:8(free)(u0x00007a80(0x004115e6:a1))

DEBUG 21: heritage
0x004115ec:2fc: **
   0x004115ec:2fc: r0x0041a048(0x004115ec:2fc) = r0x0041a048(0x004115c8:2fb) [] i0x004115ec:a5:8(free)
0x004115ec:312: **
   0x004115ec:312: s0xfffffe80(0x004115ec:312) = s0xfffffe80(0x004115c8:311) [] i0x004115ec:a5:8(free)
0x004115ec:325: **
   0x004115ec:325: s0xfffffe84(0x004115ec:325) = s0xfffffe84(0x004115c8:324) [] i0x004115ec:a5:8(free)
0x004115ec:338: **
   0x004115ec:338: s0xfffffe88(0x004115ec:338) = s0xfffffe88(0x004115c8:337) [] i0x004115ec:a5:8(free)
0x004115ec:34b: **
   0x004115ec:34b: s0xfffffe8c(0x004115ec:34b) = s0xfffffe8c(0x004115c8:34a) [] i0x004115ec:a5:8(free)
0x004115ec:35e: **
   0x004115ec:35e: s0xfffffe90(0x004115ec:35e) = s0xfffffe90(0x004115c8:35d) [] i0x004115ec:a5:8(free)
0x004115ec:371: **
   0x004115ec:371: s0xfffffe94(0x004115ec:371) = s0xfffffe94(0x004115ec:a4) [] i0x004115ec:a5:8(free)
0x004115ec:384: **
   0x004115ec:384: s0xfffffe98(0x004115ec:384) = s0xfffffe98(0x004115c8:383) [] i0x004115ec:a5:8(free)
0x004115ec:397: **
   0x004115ec:397: s0xfffffe9c(0x004115ec:397) = s0xfffffe9c(0x004115c8:396) [] i0x004115ec:a5:8(free)
0x004115ec:3aa: **
   0x004115ec:3aa: s0xfffffea0(0x004115ec:3aa) = s0xfffffea0(0x004115c8:3a9) [] i0x004115ec:a5:8(free)
0x004115ec:3bd: **
   0x004115ec:3bd: s0xfffffea4(0x004115ec:3bd) = s0xfffffea4(0x004115c8:3bc) [] i0x004115ec:a5:8(free)
0x004115ec:3d0: **
   0x004115ec:3d0: s0xfffffea8(0x004115ec:3d0) = s0xfffffea8(0x004115c8:3cf) [] i0x004115ec:a5:8(free)
0x004115ec:3e3: **
   0x004115ec:3e3: s0xfffffeb0(0x004115ec:3e3) = s0xfffffeb0(0x004115c8:3e2) [] i0x004115ec:a5:8(free)
0x004115ec:3f6: **
   0x004115ec:3f6: s0xfffffebc(0x004115ec:3f6) = s0xfffffebc(0x004115c8:3f5) [] i0x004115ec:a5:8(free)
0x004115ec:409: **
   0x004115ec:409: s0xfffffec8(0x004115ec:409) = s0xfffffec8(0x004115c8:408) [] i0x004115ec:a5:8(free)
0x004115ec:41c: **
   0x004115ec:41c: s0xfffffed4(0x004115ec:41c) = s0xfffffed4(0x004115d0:8f) [] i0x004115ec:a5:8(free)
0x004115ec:42f: **
   0x004115ec:42f: s0xfffffee0(0x004115ec:42f) = s0xfffffee0(0x004115c8:42e) [] i0x004115ec:a5:8(free)
0x004115ec:442: **
   0x004115ec:442: s0xfffffeec(0x004115ec:442) = s0xfffffeec(0x004115c8:441) [] i0x004115ec:a5:8(free)
0x004115ec:455: **
   0x004115ec:455: s0xfffffef8(0x004115ec:455) = s0xfffffef8(0x004115c8:454) [] i0x004115ec:a5:8(free)
0x004115ec:468: **
   0x004115ec:468: s0xffffff04(0x004115ec:468) = s0xffffff04(0x004115c8:467) [] i0x004115ec:a5:8(free)
0x004115ec:47b: **
   0x004115ec:47b: s0xffffffd0(0x004115ec:47b) = s0xffffffd0(0x004115c8:47a) [] i0x004115ec:a5:8(free)
0x004115ec:48e: **
   0x004115ec:48e: s0xffffffdc(0x004115ec:48e) = s0xffffffdc(0x004115c8:48d) [] i0x004115ec:a5:8(free)
0x004115ec:4a1: **
   0x004115ec:4a1: s0xffffffe8(0x004115ec:4a1) = s0xffffffe8(0x004115c8:4a0) [] i0x004115ec:a5:8(free)
0x004115ec:4b4: **
   0x004115ec:4b4: s0xfffffff0(0x004115ec:4b4) = s0xfffffff0(0x004115c8:4b3) [] i0x004115ec:a5:8(free)
0x004115ec:4c7: **
   0x004115ec:4c7: s0xfffffff4(0x004115ec:4c7) = s0xfffffff4(0x004115c8:4c6) [] i0x004115ec:a5:8(free)
0x004115ec:4da: **
   0x004115ec:4da: s0xfffffff8(0x004115ec:4da) = s0xfffffff8(0x004115d6:92) [] i0x004115ec:a5:8(free)
0x004115ec:4ed: **
   0x004115ec:4ed: s0xfffffffc(0x004115ec:4ed) = s0xfffffffc(0x004115c8:4ec) [] i0x004115ec:a5:8(free)

DEBUG 22: deadcode
0x004115ec:a3: ESP(0x004115ec:a3) = ESP(i) + #0xfffffe94
   0x004115ec:a3: **
0x004115ec:312: s0xfffffe80(0x004115ec:312) = s0xfffffe80(0x004115c8:311) [] i0x004115ec:a5:8(free)
   0x004115ec:312: **
0x004115ec:325: s0xfffffe84(0x004115ec:325) = s0xfffffe84(0x004115c8:324) [] i0x004115ec:a5:8(free)
   0x004115ec:325: **
0x004115ec:338: s0xfffffe88(0x004115ec:338) = s0xfffffe88(0x004115c8:337) [] i0x004115ec:a5:8(free)
   0x004115ec:338: **
0x004115ec:34b: s0xfffffe8c(0x004115ec:34b) = s0xfffffe8c(0x004115c8:34a) [] i0x004115ec:a5:8(free)
   0x004115ec:34b: **
0x004115ec:397: s0xfffffe9c(0x004115ec:397) = s0xfffffe9c(0x004115c8:396) [] i0x004115ec:a5:8(free)
   0x004115ec:397: **
0x004115ec:3aa: s0xfffffea0(0x004115ec:3aa) = s0xfffffea0(0x004115c8:3a9) [] i0x004115ec:a5:8(free)
   0x004115ec:3aa: **
0x004115ec:3bd: s0xfffffea4(0x004115ec:3bd) = s0xfffffea4(0x004115c8:3bc) [] i0x004115ec:a5:8(free)
   0x004115ec:3bd: **
0x004115ec:409: s0xfffffec8(0x004115ec:409) = s0xfffffec8(0x004115c8:408) [] i0x004115ec:a5:8(free)
   0x004115ec:409: **
0x004115ec:42f: s0xfffffee0(0x004115ec:42f) = s0xfffffee0(0x004115c8:42e) [] i0x004115ec:a5:8(free)
   0x004115ec:42f: **
0x004115ec:442: s0xfffffeec(0x004115ec:442) = s0xfffffeec(0x004115c8:441) [] i0x004115ec:a5:8(free)
   0x004115ec:442: **
0x004115ec:455: s0xfffffef8(0x004115ec:455) = s0xfffffef8(0x004115c8:454) [] i0x004115ec:a5:8(free)
   0x004115ec:455: **
0x004115ec:468: s0xffffff04(0x004115ec:468) = s0xffffff04(0x004115c8:467) [] i0x004115ec:a5:8(free)
   0x004115ec:468: **
0x004115ec:47b: s0xffffffd0(0x004115ec:47b) = s0xffffffd0(0x004115c8:47a) [] i0x004115ec:a5:8(free)
   0x004115ec:47b: **
0x004115ec:48e: s0xffffffdc(0x004115ec:48e) = s0xffffffdc(0x004115c8:48d) [] i0x004115ec:a5:8(free)
   0x004115ec:48e: **
0x004115ec:4ed: s0xfffffffc(0x004115ec:4ed) = s0xfffffffc(0x004115c8:4ec) [] i0x004115ec:a5:8(free)
   0x004115ec:4ed: **

DEBUG 23: indirectcollapse
0x004115ec:384: s0xfffffe98(0x004115ec:384) = s0xfffffe98(0x004115c8:383) [] i0x004115ec:a5:8(free)
   0x004115ec:384: s0xfffffe98(0x004115ec:384) = s0xfffffe98(0x00411563:3d) [] i0x004115ec:a5:8(free)

DEBUG 24: propagatecopy
0x004115ec:a5: EAX(0x004115ec:a5) = call fCls3:8(free)(u0x00007a80(0x004115e6:a1))
   0x004115ec:a5: EAX(0x004115ec:a5) = call fCls3:8(free)(EAX(0x004115c8:83))

DEBUG 25: earlyremoval
0x004115ec:35e: s0xfffffe90(0x004115ec:35e) = s0xfffffe90(0x004115c8:35d) [] i0x004115ec:a5:8(free)
   0x004115ec:35e: **

DEBUG 26: earlyremoval
0x004115ec:371: s0xfffffe94(0x004115ec:371) = s0xfffffe94(0x004115ec:a4) [] i0x004115ec:a5:8(free)
   0x004115ec:371: **

DEBUG 27: indirectcollapse
0x004115ec:384: s0xfffffe98(0x004115ec:384) = s0xfffffe98(0x00411563:3d) [] i0x004115ec:a5:8(free)
   0x004115ec:384: **

DEBUG 28: propagatecopy
0x004115ec:41c: s0xfffffed4(0x004115ec:41c) = s0xfffffed4(0x004115d0:8f) [] i0x004115ec:a5:8(free)
   0x004115ec:41c: s0xfffffed4(0x004115ec:41c) = EAX(0x004115c8:83) [] i0x004115ec:a5:8(free)

DEBUG 29: earlyremoval
0x004115ec:a4: s0xfffffe94(0x004115ec:a4) = #0x4115f1
   0x004115ec:a4: **

DEBUG 30: setcasts
0x004115ec:50b: **
   0x004115ec:50b: EAX(0x004115ec:50b) = (cast) u0x10000129(0x004115ec:a5)
0x004115ec:a5: EAX(0x004115ec:a5) = call fCls3:8(free)(EAX(0x004115c8:50a))
   0x004115ec:a5: u0x10000129(0x004115ec:a5) = call fCls3:8(free)(EAX(0x004115c8:50a))

Decompilation complete
In my case, I wanted to know why the function call at 0x4115ec thinks that EAX is being passed as an argument instead of ECX.
Here is ChatGPT's explanation. And it's right! ECX will be equal to the value of EAX at the time of the call.
Useful commands
- Pressing tab will auto-complete the available commands. There isn't a help
command.

list actionshows the plan of actions/passesdebug action foocan enable extra debug info for some actions, such asinputprototype
Sometimes it is necessary to use a bleeding edge Linux kernel such as
drm-intel-next to debug hardware issues. In this post, I'll discuss how to do
this on Ubuntu Jammy.
Ubuntu has a pretty cool automated mainline kernel build
system that also tracks branches like
drm-tip and drm-intel-next. Sadly, it's usually based off whatever Ubuntu
release is under development, and may not be compatible with the most recent LTS
release. This is currently the case with Ubuntu Jammy.
I want to run drm-intel-next, which is available
here. But if you
attempt to install this kernel on Jammy, and have DKMS modules, you'll run into
an error because Jammy's glibc version is too old. The solution is to build the
kernel from scratch. But since there aren't any source debs, and there doesn't
really seem to be any documentation, I always forget how to do this.
So here's how to do it. The first step is that we'll checkout the kernel source from git. Right now, at the top of the drm-intel-next mainlage page it says:
To obtain the source from which they are built fetch the commit below:
git://git.launchpad.net/~ubuntu-kernel-test/ubuntu/+source/linux/+git/mainline-crack cod/mainline/cod/tip/drm-intel-next/2023-10-13
So we'll do that:
~/kernels $ git clone --depth 1 -b cod/mainline/cod/tip/drm-intel-next/2023-10-13 https://git.launchpad.net/~ubuntu-kernel-test/ubuntu/+source/linux/+git/mainline-crack drm-intel-next
Cloning into 'drm-intel-next'...
remote: Enumerating objects: 86818, done.
remote: Counting objects: 100% (86818/86818), done.
remote: Compressing objects: 100% (82631/82631), done.
remote: Total 86818 (delta 10525), reused 21994 (delta 3264)
Receiving objects: 100% (86818/86818), 234.75 MiB | 2.67 MiB/s, done.
Resolving deltas: 100% (10525/10525), done.
Note: switching to '458311d2d5e13220df5f8b10e444c7252ac338ce'.

You are in 'detached HEAD' state. You can look around, make experimental
changes and commit them, and you can discard any commits you make in this
state without impacting any branches by switching back to a branch.

If you want to create a new branch to retain commits you create, you may
do so (now or later) by using -c with the switch command. Example:

  git switch -c <new-branch-name>

Or undo this operation with:

  git switch -

Turn off this advice by setting config variable advice.detachedHead to false

Updating files: 100% (81938/81938), done.
Side note: The --depth 1 will speed the clone up, because we don't really care
about the entire git history.
Next, cd drm-intel-next.
As a sanity check, verify that the debian directory, which contains the Ubuntu
build scripts, is present.
To start, you need to run fakeroot debian/rules clean which will generate a
few files including debian/changelog.
Next, run fakeroot debian/rules binary and wait a few seconds. I got an error:
~/k/drm-intel-next $ fakeroot debian/rules binary
[... snip ...]
make ARCH=x86 CROSS_COMPILE=x86_64-linux-gnu- HOSTCC=x86_64-linux-gnu-gcc-13 CC=x86_64-linux-gnu-gcc-13 KERNELVERSION=6.6.0-060600rc2drmintelnext20231013- CONFIG_DEBUG_SECTION_MISMATCH=y KBUILD_BUILD_VERSION="202310130203" LOCALVERSION= localver-extra= CFLAGS_MODULE="-DPKG_ABI=060600rc2drmintelnext20231013" PYTHON=python3 O=/home/ed/kernels/drm-intel-next/debian/tmp-headers INSTALL_HDR_PATH=/home/ed/kernels/drm-intel-next/debian/linux-libc-dev/usr -j16 headers_install
make[1]: Entering directory '/home/ed/kernels/drm-intel-next'
make[2]: Entering directory '/home/ed/kernels/drm-intel-next/debian/tmp-headers'
  HOSTCC  scripts/basic/fixdep
/bin/sh: 1: x86_64-linux-gnu-gcc-13: not found
make[4]: *** [/home/ed/kernels/drm-intel-next/scripts/Makefile.host:114: scripts/basic/fixdep] Error 127
make[3]: *** [/home/ed/kernels/drm-intel-next/Makefile:633: scripts_basic] Error 2
make[2]: *** [/home/ed/kernels/drm-intel-next/Makefile:234: __sub-make] Error 2
make[2]: Leaving directory '/home/ed/kernels/drm-intel-next/debian/tmp-headers'
make[1]: *** [Makefile:234: __sub-make] Error 2
make[1]: Leaving directory '/home/ed/kernels/drm-intel-next'
make: *** [debian/rules.d/2-binary-arch.mk:559: install-arch-headers] Error 2
Naturally, gcc-13 isn't available on Jammy. This is why I hate computers.
gcc-13 appears hard-coded into the build scripts:
~/k/drm-intel-next $ fgrep -R gcc-13 .
./init/Kconfig:# It's still broken in gcc-13, so no upper bound yet.
./debian/control: gcc-13, gcc-13-aarch64-linux-gnu [arm64] <cross>, gcc-13-arm-linux-gnueabihf [armhf] <cross>, gcc-13-powerpc64le-linux-gnu [ppc64el] <cross>, gcc-13-riscv64-linux-gnu [riscv64] <cross>, gcc-13-s390x-linux-gnu [s390x] <cross>, gcc-13-x86-64-linux-gnu [amd64] <cross>,
./debian/rules.d/0-common-vars.mk:export gcc?=gcc-13
./debian.master/config/annotations:CONFIG_CC_VERSION_TEXT                          policy<{'amd64': '"x86_64-linux-gnu-gcc-13 (Ubuntu 13.2.0-4ubuntu3) 13.2.0"', 'arm64': '"aarch64-linux-gnu-gcc-13 (Ubuntu 13.2.0-4ubuntu3) 13.2.0"', 'armhf': '"arm-linux-gnueabihf-gcc-13 (Ubuntu 13.2.0-4ubuntu3) 13.2.0"', 'ppc64el': '"powerpc64le-linux-gnu-gcc-13 (Ubuntu 13.2.0-4ubuntu3) 13.2.0"', 'riscv64': '"riscv64-linux-gnu-gcc-13 (Ubuntu 13.2.0-4ubuntu3) 13.2.0"', 's390x': '"s390x-linux-gnu-gcc-13 (Ubuntu 13.2.0-4ubuntu3) 13.2.0"'}>
Well, let's change them to gcc-12 and see what happens. Be prepared to wait a lot longer this time...
~/k/drm-intel-next $ sed -i -e 's/gcc-13/gcc-12/g' debian/{control,rules.d/0-common-vars.mk} debian.master/config/annotations
~/k/drm-intel-next $ fakeroot debian/rules binary
[... lots of kernel compilation output ...]
# Compress kernel modules
find debian/linux-image-unsigned-6.6.0-060600rc2drmintelnext20231013-generic -name '*.ko' -print0 | xargs -0 -n1 -P 16 zstd -19 --quiet --rm
stdout is a console, aborting
make: *** [debian/rules.d/2-binary-arch.mk:622: binary-generic] Error 123
Well, that's annoying. It seems that the general build logic calls zstd to
compress any found files. But if none are found, then the rule fails. Perhaps
newer versions of zstd don't fail when called on no arguments. Anyway, apply
the following patch to use xargs -r to fix this:
--- a/debian/rules.d/2-binary-arch.mk
+++ b/debian/rules.d/2-binary-arch.mk
@@ -568,7 +568,7 @@ define dh_all
        dh_installdocs -p$(1)
        dh_compress -p$(1)
        # Compress kernel modules
-       find debian/$(1) -name '*.ko' -print0 | xargs -0 -n1 -P $(CONCURRENCY_LEVEL) zstd -19 --quiet --rm
+       find debian/$(1) -name '*.ko' -print0 | xargs -r -0 -n1 -P $(CONCURRENCY_LEVEL) zstd -19 --quiet --rm
        dh_fixperms -p$(1) -X/boot/
        dh_shlibdeps -p$(1) $(shlibdeps_opts)
        dh_installdeb -p$(1)
Re-run fakeroot debian/rules binary and if all goes well, you should end up
with a bunch of .deb files in the parent directory, and something like:
~/k/drm-intel-next $ fakeroot debian/rules binary
[... lots of kernel compilation output ...]
dpkg-deb: building package 'linux-source-6.6.0' in '../linux-source-6.6.0_6.6.0-060600rc2drmintelnext20231013.202310130203_all.deb'.
dpkg-deb: building package 'linux-headers-6.6.0-060600rc2drmintelnext20231013' in '../linux-headers-6.6.0-060600rc2drmintelnext20231013_6.6.0-060600rc2drmintelnext20231013.202310130203_all.deb'.
dpkg-deb: building package 'linux-tools-common' in '../linux-tools-common_6.6.0-060600rc2drmintelnext20231013.202310130203_all.deb'.
dpkg-deb: building package 'linux-cloud-tools-common' in '../linux-cloud-tools-common_6.6.0-060600rc2drmintelnext20231013.202310130203_all.deb'.
dpkg-deb: building package 'linux-tools-host' in '../linux-tools-host_6.6.0-060600rc2drmintelnext20231013.202310130203_all.deb'.
dpkg-deb: building package 'linux-doc' in '../linux-doc_6.6.0-060600rc2drmintelnext20231013.202310130203_all.deb'.
Now install the desired packages with sudo dpkg -i <paths to .deb files>.
Some days I hate computers. Today is one of those days. My work computer froze over the weekend (which is another long, frustrating story that I won't go into right now), so I had to reboot. As usual, I logged into our Pulse Secure VPN, and opened up Chrome. And Chrome can't resolve anything. I can't get to regular internet sites or intranet sites. What the heck?
My first thought is that this is somehow proxy related. But no, even when disabling the proxy, I still can't resolve internal hostnames.
But tools like dig and ping work. I open up Firefox, and that works too.
OK, that's weird. I open up chrome://net-internals/#dns in Chrome and confirm
that it can't resolve anything. I try flushing the cache, but that doesn't
work. I try a few other things, like disabling DNS prefetching and safe
browsing, but none of those help either.
I take a look at /etc/resolv.conf, which contains a VPN DNS server presumably
added by Pulse Secure, and 127.0.0.53 for the systemd-resolved resolver. I
confirm that resolvectl does not know about the Pulse Secure DNS server. I
add it manually with resolvectl dns tun0 <server>, and Chrome starts working
again. OK, well that's good. But how do we fix it permanently?
This seems relevant: PulseSecure VPN does not work with
systemd-resolved. Oh, maybe
not. The "fix" is to publish documentation that the Pulse Secure developers
should read. Sigh. After reading more closely, I see something about the
resolvconf command, which they do already support. I don't seem to have that
command, but that is easily fixed by a apt install resolvconf, and I confirm
that after reconnecting to the VPN, systemd-resolved knows of the VPN DNS
servers. And Chrome works. Yay!
So what happened that this suddenly became a problem? I'm not sure. One
possibility is that Chrome started ignoring /etc/resolv.conf and directly
using systemd-resolved if it appears to be available.
I really hate when my computer stops working, so I hope that if you are affected by this problem and find this blog post, it helps you out.
I've been feeling left behind by all the exciting news surrounding AI, so I've been quietly working on a project to get myself up to speed with some modern Transformers models for NLP. This project is mostly a learning exercise, but I'm sharing it in the hopes that it is still interesting!
Background: Functions, Methods and OOAnalyzer
One of my favorite projects is OOAnalyzer, which is part of SEI's Pharos static binary analysis framework. As the name suggests, it is a binary analysis tool for analyzing object-oriented (OO) executables to learn information about their high level structure. This structure includes classes, the methods assigned to each class, and the relationships between classes (such as inheritance). What's really cool about OOAnalyzer is that it is built on rules written in Prolog -- yes, Prolog! So it's both interesting academically and practically; people do use OOAnalyzer in practice. For more information, check out the original paper or a video of my talk.
Along the way to understanding a program's class hierarchy, OOAnalyzer needs to solve many smaller problems. One of these problems is: Given a function in an executable, does this function correspond to an object-oriented method in the source code? In my humble opinion, OOAnalyzer is pretty awesome, but one of the yucky things about it is that it contains many hard-coded assumptions that are only valid for Microsoft Visual C++ on 32-bit x86 (or just x86 MSVC to save some space!)
It just so happens that on
this compiler and platform, most OO methods use the thiscall calling
convention, which passes a pointer to the this object in the ecx register. Below is an interactive Godbolt example that shows a simple method mymethod being compiled by x86 MSVC. You can see on line 7 that the thisptr is copied from ecx onto the stack at offset -4. On line 9, you can see that arg is passed on the stack. In contrast, on line 20, myfunc only receives its argument on the stack, and does not access ecx.
(Note that this assembly code comes from the compiler and includes the name of functions, which makes it obvious whether a function corresponds to an OO method. Unfortunately this is not the case when reverse engineering without access to source code!)
Because most non-thisptr arguments are passed on the stack in x86 MSVC, but the thisptr is passed in ecx, seeing an argument in the ecx register is highly suggestive (but not definitive) that the function corresponds to an OO
method. OOAnalyzer has a variety of heuristics based on this notion that tries
to determine whether a function corresponds to an OO method. These work well,
but they're specific to x86 MSVC. What if we wanted to
generalize to other compilers? Maybe we could learn to do that. But first,
let's see if we can learn to do this for x86 MSVC.
Learning to the Rescue
Let's play with some machine learning!
Step 1: Create a Dataset
You can't learn without data, so the first thing I had to do was create a dataset. Fortunately, I already had a lot of useful tools and projects for generating ground truth about OO programs that I could reuse.
BuildExes
The first project I used was BuildExes. This is a project that takes several test programs that are distributed as part of OOAnalyzer and builds them with many versions of MSVC and a variety of compiler options. The cute thing about BuildExes is that it uses Azure pipelines to install different versions of MSVC using the Chocolatey package manager and perform the compilations. Otherwise we'd have to install eight MSVC versions, which sounds like a pain to me. BuildExes uses a mix of publicly available Chocolatey packages and some that I created for older versions of MSVC that no one else cares about 🤣.
When BuildExes runs on Azure pipelines, it produces an artifact consisting of a large number of executables that I can use as my dataset.
Ground Truth
As part of our evaluations for the OOAnalyzer paper, we wrote a variety of scripts that extracted ground truth information out of PDB debugging symbols files (which, conveniently, are also included in the BuildExes artifact!) These scripts aren't publicly available, but they aren't top secret and we've shared them with other researchers. They essentially call a tool to decode PDB files into a textual representation and then parse the results.
Putting it Together
Here is the script that produces the ground truth
dataset.
It's a bit obscure, but it's not very complicated. Basically, for each executable in the BuildExes
project, it reads the ground truth file, and also uses the bat-dis
tool from the ROSE Binary
Analysis Framework to
disassemble the program.
The initial dataset is available on 🤗 HuggingFace. Aside: I love that 🤗 HuggingFace lets you browse datasets to see what they look like.
Step 2: Split the Data
The next step is to split the data into training and test sets. In ML, the best practice is generally to ensure that there is no overlap between the training and test sets. This is so that the performance of a model on the test set represents performance on "unseen examples" that the model has not been trained on. But this is tricky for a few reasons.
First, software is natural, which means that we can expect that distinct programmers will naturally write the same code over and over again. If a function is independently written multiple times, should it really count as an "previously seen example"? Unfortunately, we can't distinguish when a function is independently written multiple times or simply copied. So when we encounter a duplicate function, what should we do? Discard it entirely? Allow it to be in both the training and test sets? There is a related question for functions that are very similar. If two functions only differ by an identifier name, would knowledge of one constitute knowledge of the other?
Second, compilers introduce a lot of functions that are not written by the programmer, and thus are very, very common. If you look closely at our dataset, it is actually dominated by compiler utility functions and functions from the standard library. In a real-world setting, it is probably reasonable to assume that an analyst has seen these before. Should we discard these, or allow them to be in both the training and test sets, with the understanding that they are special in some way?
Constructing a training and test split has to take into account these questions. I actually created an additional dataset that splits the data via different mechanisms.
I think the most intuitively correct one is what I call splitting by library
functions. The idea is quite simple. If a function name appears in the
compilation of more than one test program, we call it a library function. For
example, if we compile oo2.cpp and oo3.cpp to oo2.exe and oo3.exe
respectively, and both executables contain a function called
msvc_library_function, then that function is probably introduced by the
compiler or standard library, and we call it a library function. If function
oo2_special_fun only appears in oo2.exe and no other executables, then we
call it a non-library function. We then split the data into training and test
sets such that the training set consists only of library functions, and the test
set consists only of non-library functions. In essence, we train on the commonly
available functions, and test on the rare ones.
This idea isn't perfect, but it works pretty well, and it's easy to understand and justify. You can view this split here.
Step 3: Fine-tune a Model
Now that we have a dataset, we can fine-tune a model. I used the huggingface/CodeBERTa-small-v1 model on 🤗 HuggingFace as a base model. This is a model that was trained on a large corpus of code, but that is not trained on assembly code (and we will see some evidence of this).
My model, which I fine-tuned with the training split using the "by library" method described above, is available as ejschwartz/oo-method-test-model-bylibrary. It attains 94% accuracy on the test set, which I thought was pretty good. I suspect that OOAnalyzer performs similarly well.
If you are familiar with the 🤗 Transformers library, it's actually quite easy to use my model (or someone else's). You can actually click on the "Use in Transformers" button on the model page, and it will show you the Python code to use. But if you're a mere mortal, never fear, as I've created a Space for you to play with, which is embedded here:
If you want, you can upload your own x86 MSVC executable. But if you don't
have one of those lying around, you can just click on one of the built-in example
executables at the bottom of the space (ooex8.exe and
ooex9.exe). From there, you can select a function from the dropdown menu to
see its disassembly, and the model's opinion of whether it is a class method or
not. If the assembly code is too long for the model to process, you'll currently encounter an error.
Here's a recording of what it looks like:
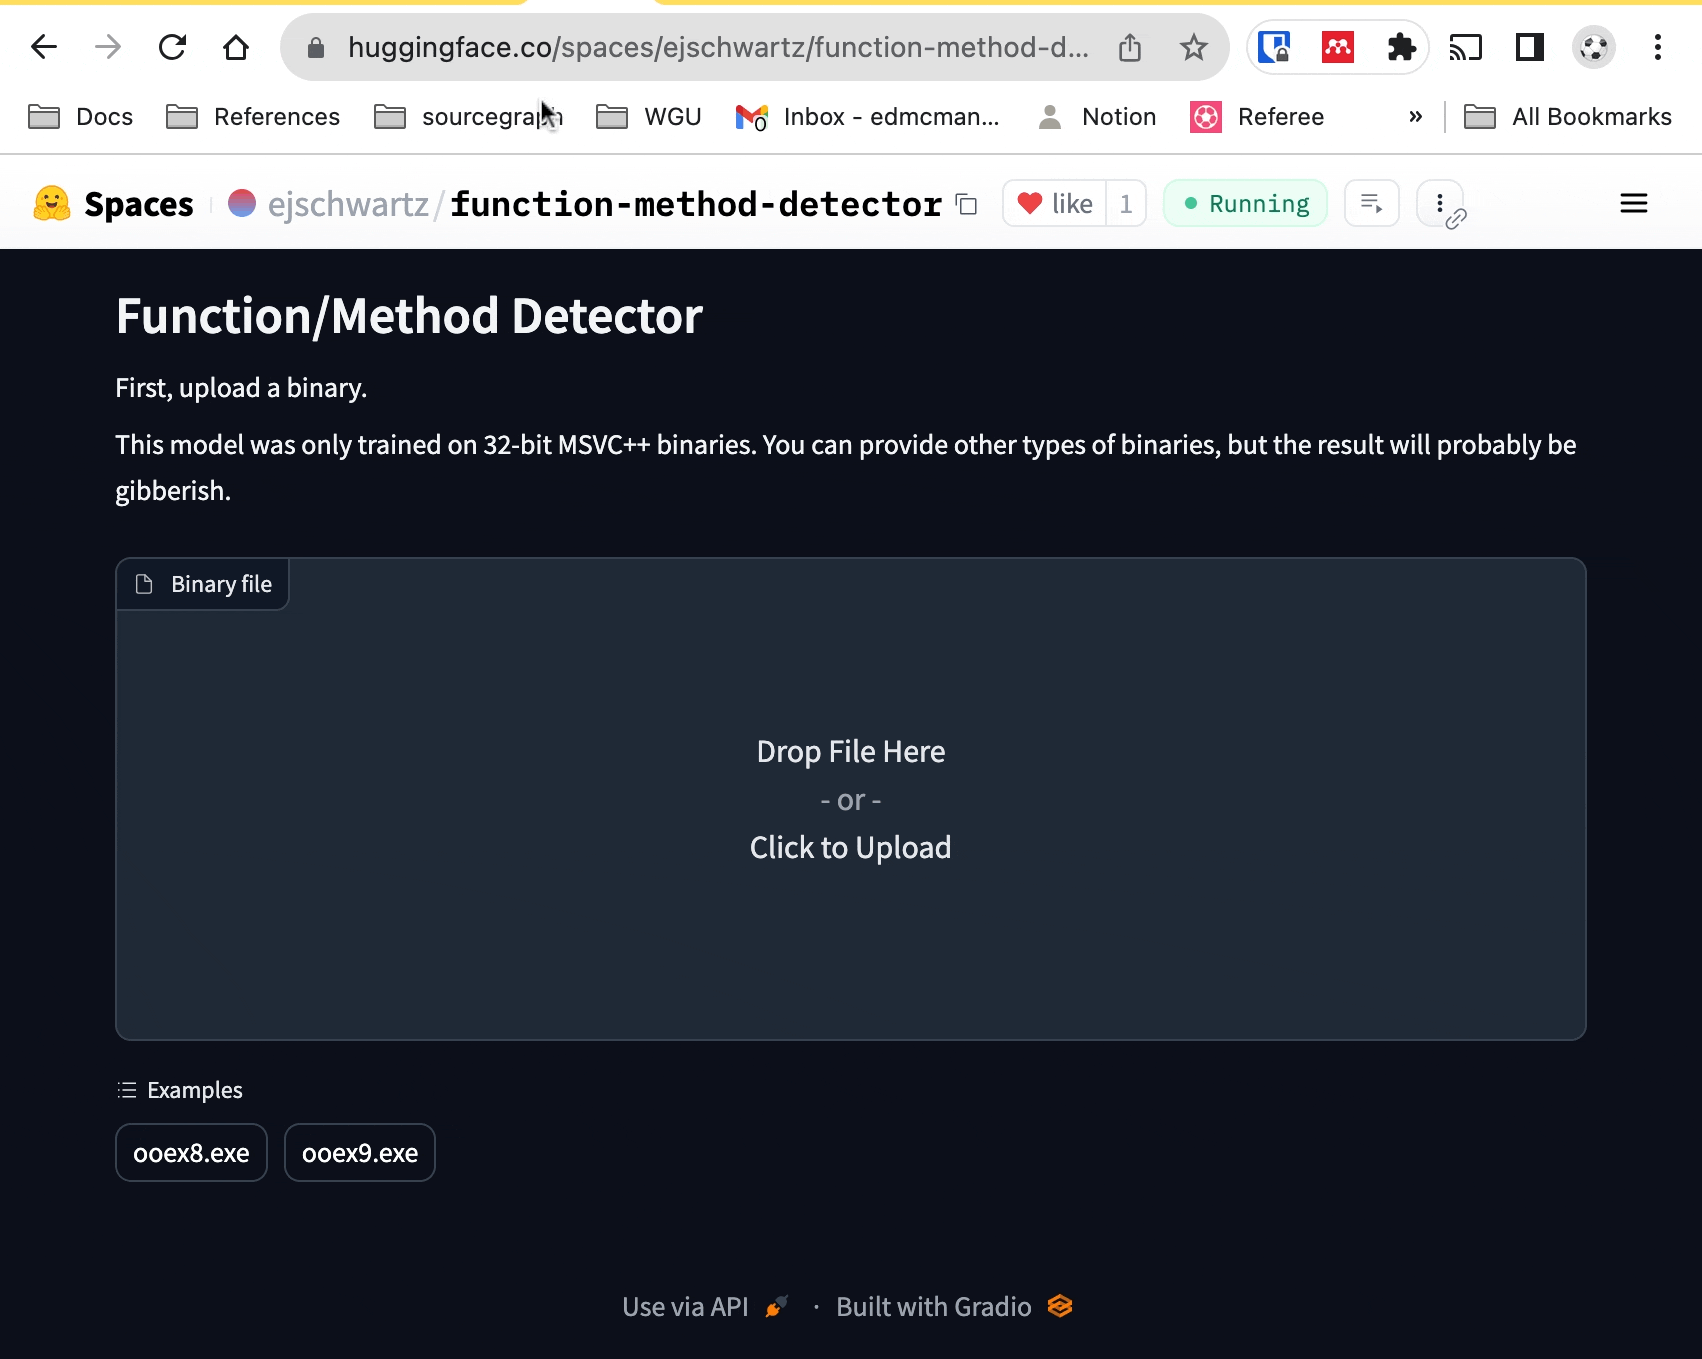
If you are very patient, you can also click on "Interpret" to run Shapley interpretation, which will show which tokens are contributing the most. But it is slow. Very slow. Like five minutes slow. It also won't give you any feedback or progress (sigh -- blame gradio, not me).
Here's an example of an interpretation. The dark red tokens contribute more to
method-ness and dark blue tokens contribute to function-ness. You can also see that
registers names are not tokens in the original CodeBERT model. For instance, ecx
and is split into ec and x, which the model learns to treat as a pair. It's
not a coincidence that the model learned that ecx is indicative of a method,
as this is a rule used in OOAnalyzer as well. It's also somewhat interesting that the model views sequences of zero bytes in the binary code as being indicative of function-ness.
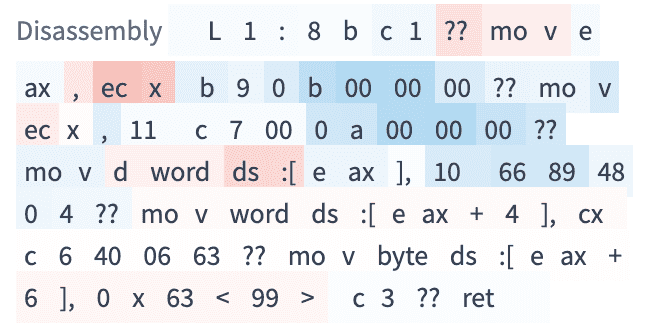
Looking Forward
Now that we've shown we can relearn a heuristic that is already included in OOAnalyzer, this raises a few other questions:
-
One of the "false positives" of the
ecxheuristics is thefastcallcalling convention, which also uses theecxregister. We should ensure that the dataset contains functions with this calling convention (and others), since they do occur in practice. -
What other parts of OOAnalyzer can we learn from examples? How does the accuracy of learned properties compare to the current implementation?
-
Can we learn to distinguish functions and methods for other architectures and compilers? Unfortunately, one bottleneck here is that our ground truth scripts only work for MSVC. But this certainly isn't an insurmountable problem.


I've mentioned a few times that I'm an avid skier. I live in central Pennsylvania though, and so the skiing is not always the best, to say the least!
I've been going to the BLISTER Summit in Crested Butte for the past two years now, and it's been a blast. The summit defies categorization; it's a cross between a huge ski demo, meet-up, and panel sessions. It's a great way to try out new gear, ski on an incredible mountain, and ski with some really awesome people, including Wendy Fisher, Chris Davenport, Drew Petersen and the BLISTER team.
Anyway, I mostly wanted to share a few fun pictures from the event. Somehow I made it into the promo video for next year's event! Sadly, it was not because of my epic skiing:
Pictures
I've been looking for a good excuse to post some pictures. So, here you go!


Powered with by Gatsby 5.0