


At some point, I hope to create a Notes section on my website that will turn Markdown files into a list of notes. This is basically how the blog works. But, I'm kind of busy. And since Gatsby seems like it's dead, I'm not sure that I want to invest a whole lot of time into it. (Although putting the notes in markdown seems like a good idea for compatibility.)
Anyway, here is my first very short note on Profiling.
SpeedScope
SpeedScope is an awesome tool for visualizing profiler output. It has a flame graph view that is wonderful. I also like to use the Sandwich view, sorting by total time and simply looking for the first function that I recognize. This is often the culprit.
The documentation is pretty good.
It also shows how to record profiles in compatible formats for most platforms.
I mostly use py-spy and perf.
Java
The one notably missing platform is Java! Luckily, it's not too hard to convert Java's async-profiler output to a format that SpeedScope can read. Here's how I do it:
- Download async-profiler
- Create an output file in
collapsedformat - You can do this in several ways, such as:
./asprof start -i 1s Ghidrafollowed by./asprof stop -o collapsed -f /tmp/out.prof.collapsed Ghidra./asprof collect -d 60 -o collapsed -f /tmp/out.prof.collapsed Ghidra- Then open
out.prof.collapsedin SpeedScope.
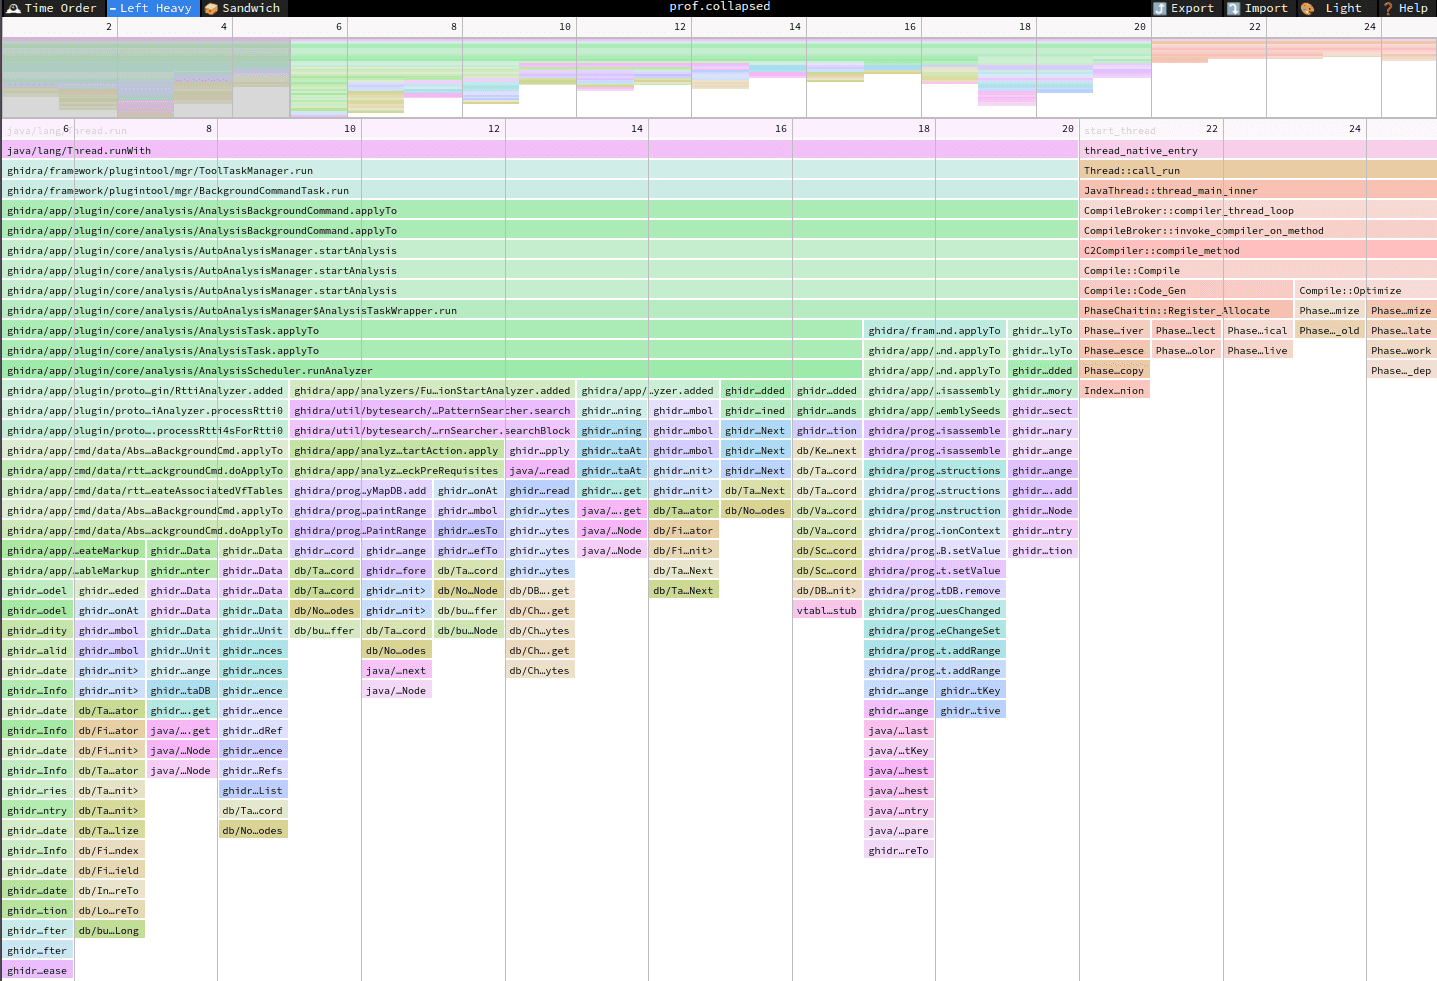
The collapsed format takes a while to parse, so it might be worth it to export the native SpeedScope format.


Fostering
My wife and I started fostering rescue dogs mostly by accident. We adopted a Shih-tzu mix, who seemed completely relaxed when we met her at the rescue. When we got home, we eventually figured out that she was terrified, and freezing was her coping mechanism. Once she got a little more comfortable, she started hiding from us in the house. It took many months, but Molly eventually warmed up to us and we gained her trust.

For as frustrating an experience it is to have a dog be absolutely terrified of you for no reason, it was also incredibly rewarding to see her come out of her shell. We decided that we wanted to help other dogs in similar situations, so we started fostering. It's been several years, and we've fostered dozens of dogs. For a long time, we fostered for A Tail to Tell, which unfortunately recently closed. More recently, we have been fostering for Lucky Dawg Animal Rescue.
Blanche
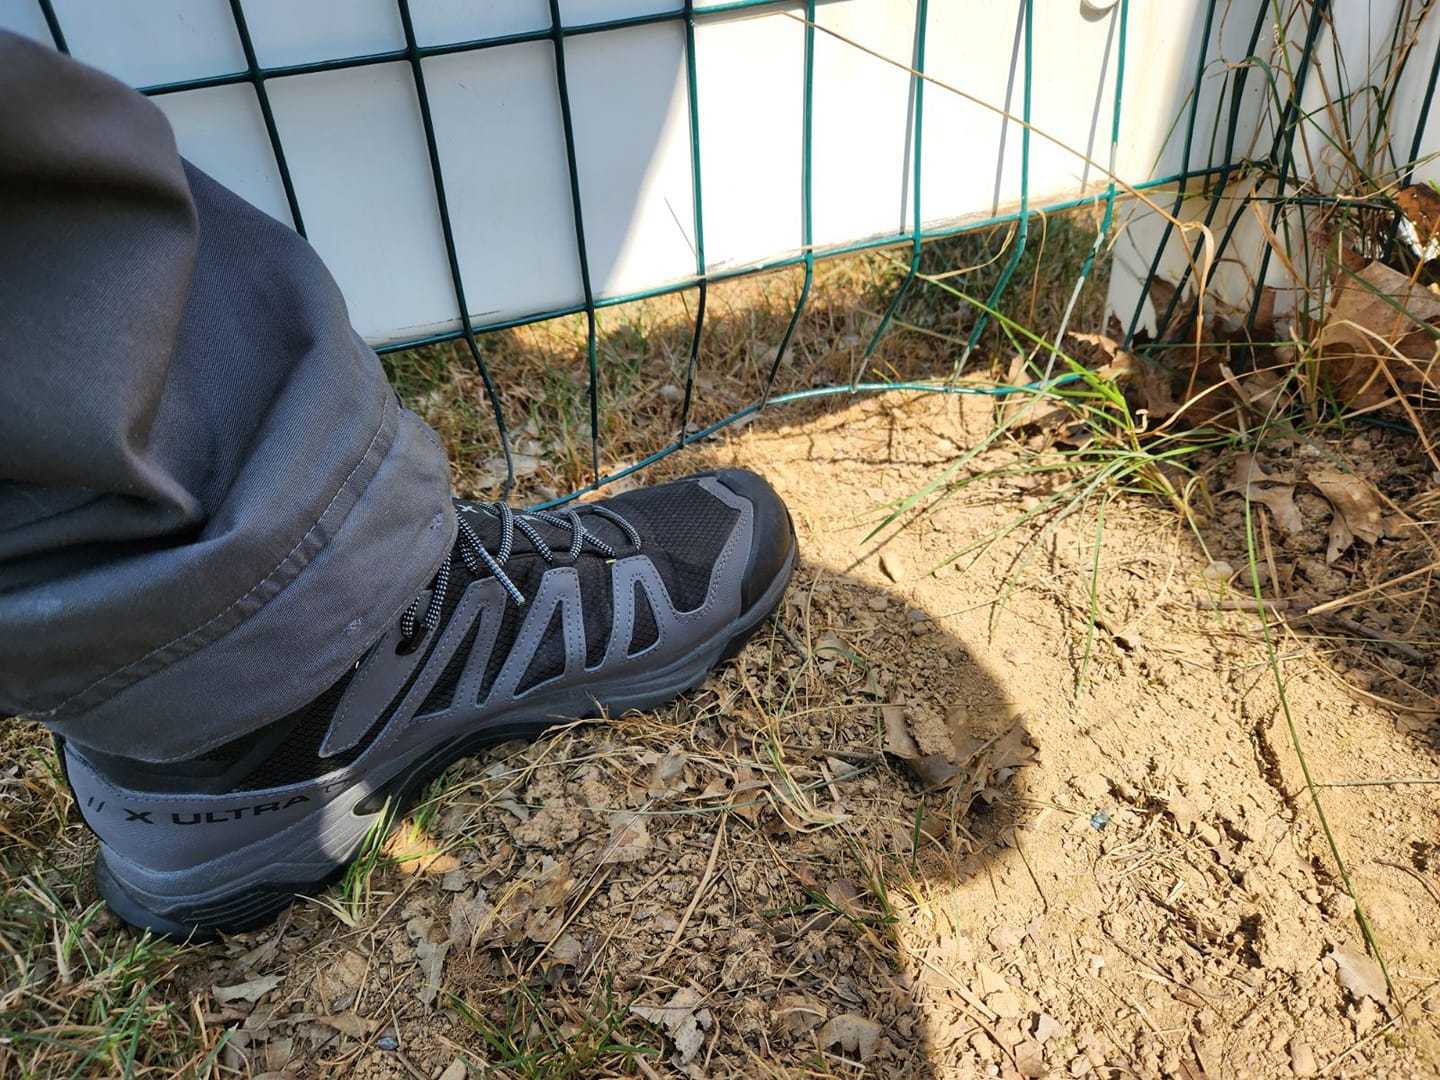
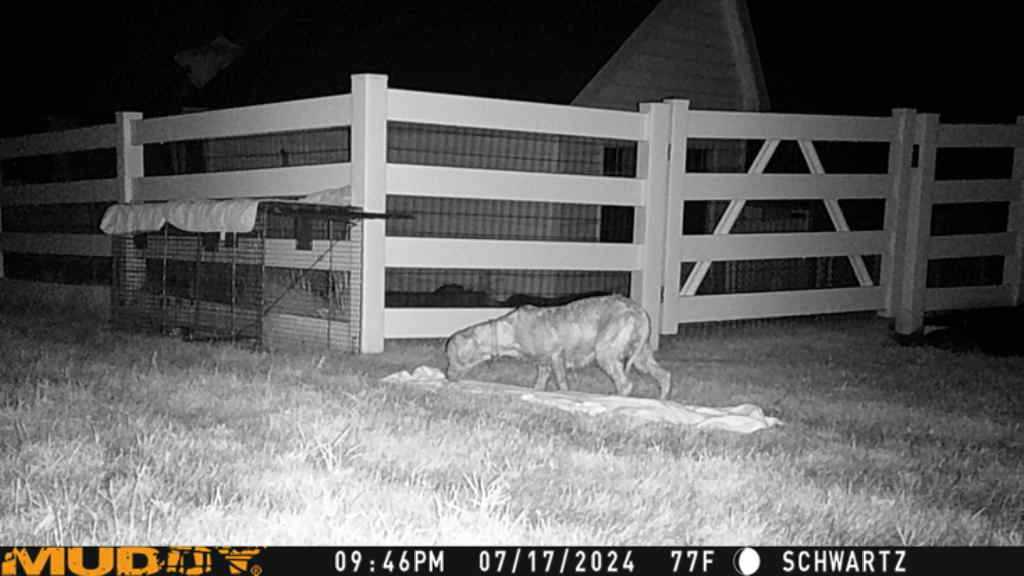
This week, however, we had a "first", and not a good one. We picked up a new foster dog, Blanche, on Sunday. We have a nice fenced in yard, and we immediately took Blanche out back into the yard. She was very skittish, and we gave her some space. She immediately dove into a row of large evergreen trees in our yard and hid. Eventually, I had to go in and carry her out, which was not a simple task given the size of the trees.

The next morning, I let Blanche out and saw her run into the same trees. It was very hot, and after about an hour, I started to grow concerned and went out to look for her. She was not in the same tree as last time, but I figured she was hiding in another one. There are several trees, and it is fairly difficult to see into them. I started exhaustively searching the trees, and I couldn't find her. I also found a part of our fence that was slightly pushed out, as if something had forced its way out. She had escaped.
The Search: Monday (Day One)
My wife and I were very upset, but we shifted into action. We reported Blanche as missing on PawBoost, our community Facebook page, called the local police department, and notified our rescue, Lucky Dawg Animal Rescue. We quickly began receiving sighting reports of Blanche. She was initially seen at approximately 10am in a wooded area next to a busy road. I went to the area and searched for her while my daughter and wife started talking to neighbors and handing out flyers. I saw no sign of her in the wooded area.
We spent the rest of the day trying to put up posters on telephone poles, which is harder than it seems! Tape doesn't adhere very well to dirty telephone poles. The trick is to tape all the way around the pole so that the tape sticks to itself.
We received another sighting report at 5pm, this time on the other side of the busy road. The report was of a dog "playing/fighting" with a chicken. Fortunately, I knew which house this was at from the description. Around the same time, two members of our rescue arrived to help. We went to the house and I talked to the owner, who revealed that Blanche had attacked her chicken. She chased Blanche off, and Blanche ran into the woods. While I was talking to the owner, our rescue members saw Blanche in a large field nearby. Blanche spotted them, and ran into a wooded area near a creek. I was able to reach the other side of the wooded area, but the experts decided that it would be better to leave a food station for Blanche so she stayed in the area rather than try to chase her.
The Search: Tuesday (Day Two)
The next morning we received a few sightings of Blanche near our neighborhood again. More surprisingly, my wife left our fence gate open and saw Blanche sniffing around the fence around 8 am. Unfortunately, Blanche ran off. It was very hot, and Blanche presumably slept during the day.
That evening, the rescue returned and put out a trap with lots of food, and a remote camera to monitor it. We cranked up the volume on my phone so that every time the camera detected movement, we would wake up. We were woken up several times, but it was mostly false positives. At 1:59am, a cat wandered by. At some point, the cat triggered the cat, and at 2:28am we were greeted by a picture of Blanche studying the cat in the trap.
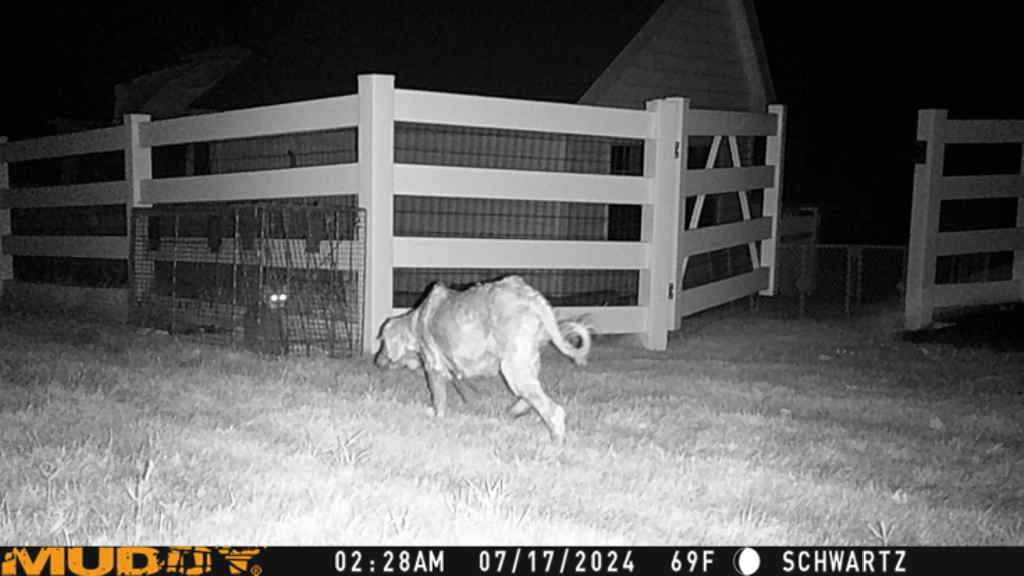
I snuck outside, and saw Blanche eating food about 10 feet away from me. It was frustrating to be so close but not be able to do anything. But our rescue members told us that it was safer to make her feel safe and comfortable with the trap. She clearly enjoyed the food that we had put out for her. She would be back.
After Blanche finished eating, we freed the cat from the trap and added more food, but we didn't see Blanche again that night. Stupid cat!
The Search: Wednesday (Day Three)
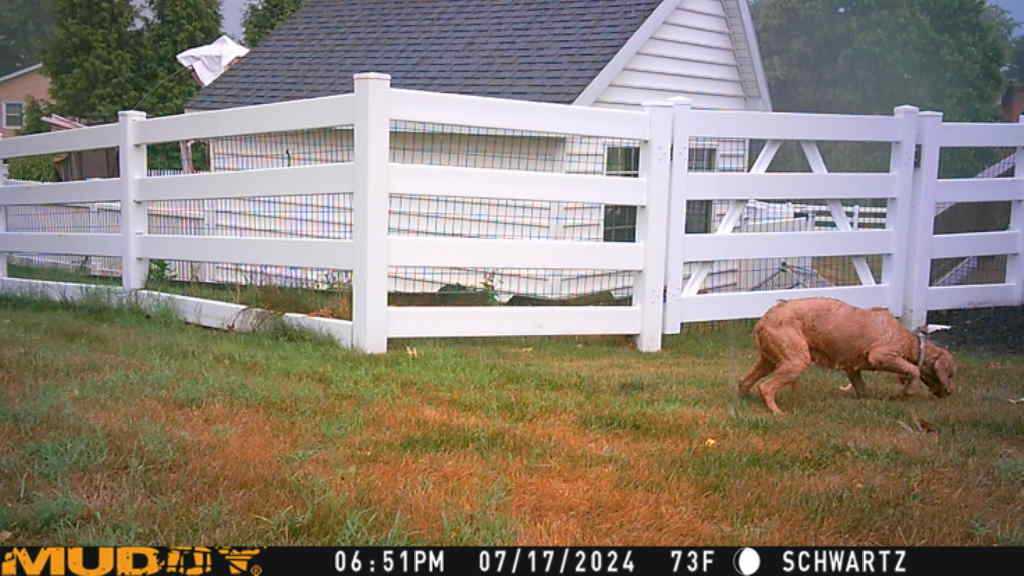
The next morning, Blanche was sighted in many of the same places, including near our house. Unfortunately, she was also seen crossing the road again. We were worried that a car would hit her. She slept during the day again. In the evening, there was heavy rain, and we decided to wait until after the rain to put the trap out. Naturally, Blanche showed up during the rain, and we missed an opportunity to catch her. Fortunately my wife had put out a couple pieces of food, so she didn't leave empty handed.
We armed the trap again and waited. She came back around 9:43pm and began investigating the trap. She was very cautious, and decided to yank out the towel on the bottom of the trap. She stayed for a very long time, as we waited in suspense for her to trigger the trap. Eventually she entered the trap, but it didn't trigger for some reason. It was frustrating, but not the end of the world. She would begin to think the trap was a safe source of food.
Blanche stayed around for a long while, but eventually left. We examined the trap. When she yanked the towel, it actually disarmed the trap without activating it. We fixed the trap and waited again, hoping she would be back later that night.
At 2:05am, she came back and began to investigate the trap again. We waited for what seemed like forever. At 2:15am, we received this picture of her deep in the trap.
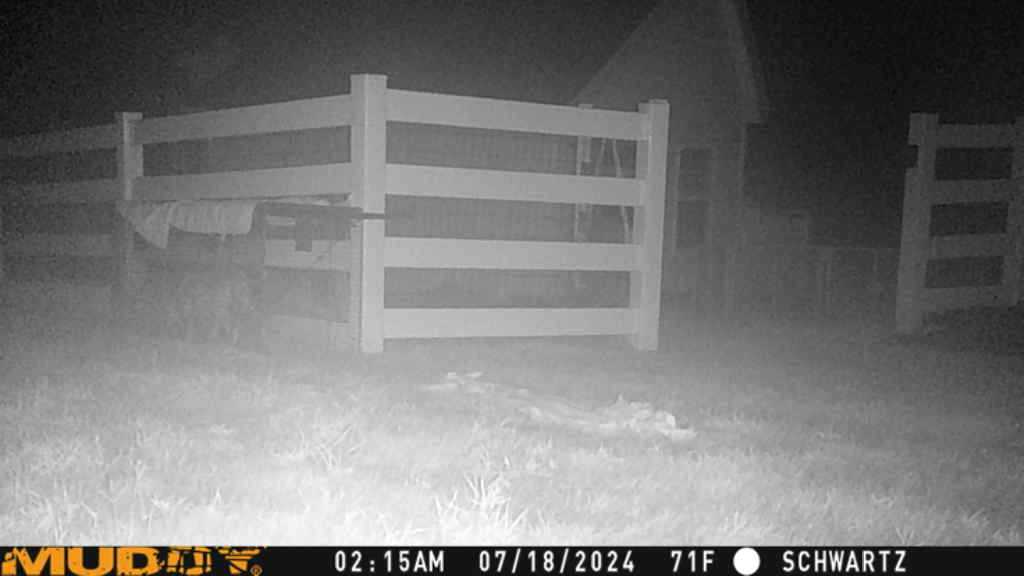
The camera we were using would take a burst of three pictures every time it detected motion. After that picture, we didn't receive any more pictures. This could mean that she was in the trap, or that the trap had not triggered and she had left. We waited for a while, and then snuck outside to check. We had caught her! We carried the trap inside and put her back into her exercise pen, and finally got some sleep.
The Aftermath
Blanche is not very happy to be back inside, but she ate, drank, and is safe. She hasn't been very lively yet, but this is not uncommon with mill rescue dogs, who often need a few days before they start to interact and show personality. Hopefully she'll quickly realize that we're not so bad, and that she is safe and sound in our house.
We have a long list of interesting stories from our years fostering rescue dogs, but this was certainly one of the more interesting and stressful ones. On the positive side, we met a lot of our neighbors, and we were pleasantly surprised by how helpful and supportive they were, without exception. Many people wanted to help in whatever way they could. We really live in a cool little community.
In my last post I talked about how I have been using Ansible for my new laptop configuration, and shared my configuration for notion.
So far, I've been extremely happy with using Ansible for configuring my machine. Prior to using Ansible, I'd spend a fair amount of time creating detailed notes that described what I did. I estimate that creating Ansible recipes takes about the same time as keeping good notes, and maybe even less. That's because there are many existing roles for common settings and software that can be reused. As with any ecosystem, the quality of such roles varies.
The big difference between my notes and Ansible, though, is that Ansible playbooks can be played in minutes, whilst manually following my notes can take hours to set up an entire new machine. I used to dread the idea of configuring a new machine. But now it's fairly effortless.
I just publicly shared my Ansible configuration. I don't expect that anyone will use my configuration as is, any more than I expect anyone to use my notion configuration! I'm extremely opinionated and picky. But I do hope that it might give people some ideas, like how to install llvm, nvidia drivers and so on. I know I personally found other people's repositories to be helpful.
In a very similar vein, I've started using
dorothy, which claims to allow you to "...
bring your dotfile commands and configuration to any shell." Since I usually
but not always use fish, I've always been hesistant to
write my own commands in fish. Plus, I have been writing bash scripts for long
enough that I'm decent at it, so it tends to be one of my go-tos. Dorothy makes
it easy to define variables and commands in such a way that they magically
appear in all shells. (Again, this is very useful for fish, which is not a
posix-compliant shell.) There's also a fair number of useful built-in commands.
Dorothy encourages users to split their dotfiles into public and private
portions, and you can view my public dotfile
here. Specifically, here are my
custom commands. Some
of these might be useful, such as setup-util-ghidra and
setup-util-ghidrathon. I've found that having a designated spot for these
types of utility commands encourages me to write them, which ultimately saves me
time. Usually.
Sometime while I was in graduate school, I started using the notion window manager. (Actually, at the time, I think it was ion3.) Notion is a tiling window manager that is geared towards keyboard usage instead of mouse usage. But let's be honest: I've been using notion for so long that I simply prefer it over anything else.
Notion, like most minor window managers, is a bit spartan. It does not provide
a desktop environment. It really just manages windows. There are some
features of a desktop environment that I don't need, such as a launcher. I know
all the commands that I use; I don't need a GUI to list them for me. But it's
often the little things that get you, such as locking the screen, or using the
media keys on your keyboard to adjust the volume. I used to be (more of) a hardcore nerd
and relished in my ability to craft a super-complex .xsessionrc file with all
kinds of bells, whistles and utilities connected as if with duct tape. But as I
grow older, sometimes I just want my computer to work.
For a long while now, I've found that running notion alongside GNOME for "desktop stuff" to work pretty well. For a long time, I followed an old Wiki post about how to combine GNOME with Awesome WM. This worked really welll with GNOME 2.
Many people say that you can't use GNOME 3 with window managers other than GNOME
Shell. I've actually had pretty good luck copying the Ubuntu gnome-session and
replacing Gnome Shell with notion. The above Awesome WM Wiki also shows how to
do it. Unfortunately, I've found that some features do not work, such as the
keyboard media keys, much to my dismay. Do media keys matter that much? Yes,
yes, they do. This apparently broke when GNOME Shell started binding the media
keys instead of gnome-settings-daemon. There
used to be a gnome-fallback-media-keys-helper utility around that would
simulate this behavior, but it seems to have disappeared.
As I was trying to fix this problem, I came across a blog post and an unrelated but similar github repo both describing how to use the i3 window manager with GNOME. TLDR: GNOME Flashback is a still supported variant of GNOME that is explicitly designed to support third-party window managers. Whereas GNOME Shell incorporates both the window manager and other stuff such as handling media keys, GNOME Flashback has the "other stuff" in a separate component that is designed to be used with a window manager such as metacity. But it works just fine with notion! Best of all, both my media keys and screen locking work. Hurray!
Because I hate setting up stuff like this, I've actually been hard at work packaging up my Linux computer configuration into reusable ansible components. It takes a little longer than doing it manually of course, but it's not too bad and it's pretty easy to read. I'm making my notion role available here in case anyone wants to try out my setup. Most of the logic is here if you are curious what is involved. Below are a few snippets to show how Ansible makes it relatively easy to manipulate configuration files.
# Same thing, but for gnome-flashback

- name: Copy gnome-flashback-metacity.session to notion-gnome-flashback.session
  copy:
    src: /usr/share/gnome-session/sessions/gnome-flashback-metacity.session
    dest: /usr/share/gnome-session/sessions/notion-gnome-flashback.session

- name: 'notion-gnome-flashback.session: Change metacity to notion and add stalonetray'
  replace:
    path: /usr/share/gnome-session/sessions/notion-gnome-flashback.session
    regexp: 'metacity'
    replace: notion;stalonetray

- name: 'notion-gnome-flashback.session: Remove gnome-panel'
  replace:
    path: /usr/share/gnome-session/sessions/notion-gnome-flashback.session
    regexp: ';gnome-panel'

- name: Symlink systemd target for notion-gnome-flashback session to gnome-flashback-metacity session
  file:
    src: /usr/lib/systemd/user/gnome-session@gnome-flashback-metacity.target.d
    dest: /usr/lib/systemd/user/gnome-session@notion-gnome-flashback.target.d
    state: link

- name: Install gconf override for notion-gnome-flashback
  copy:
    src: notion-gnome-flashback.gschema.override
    dest: /usr/share/glib-2.0/schemas/01_notion-gnome-flashback.gschema.override
  notify: Compile glib schemas
- name: Set META
lineinfile:
path: /usr/local/etc/notion/cfg_notion.lua
regexp: '^--META='
line: META="Mod4+"
backup: true
- name: Set ALTMETA
lineinfile:
path: /usr/local/etc/notion/cfg_notion.lua
regexp: '^--ALTMETA='
line: ALTMETA="Mod1+"
backup: true
- name: Disable mod_dock
lineinfile:
path: /usr/local/etc/notion/cfg_defaults.lua
state: absent
line: 'dopath("mod_dock")'
backup: true
- name: Enable mod_statusbar
lineinfile:
path: /usr/local/etc/notion/cfg_notion.lua
regexp: '^--dopath("mod_statusbar")'
line: 'dopath("mod_statusbar")'
backup: trueI'm a serial car leaser. This December, when my old lease was running out, there were not a lot of very appealing lease deals. Some of the best deals were on electric vehicles (EVs). The US offers a tax credit on some EVs for $7500. To qualify, the vehicles must be assembled in North America. But some EV manufacturers that do not meet this requirement are offering a similar rebate out of their own pocket to avoid losing customers to their competitors who do qualify. In short, because many EVs come with a 7500 dollar rebate, either from a tax credit or otherwise, EVs were some of the best deals that I could find.
Naturally, the benefit to the environment was another selling point as well!
I ended up leasing a Hyundai Ioniq 6. It's a very slick car, and there are many aspects of it that I like that are not EV specific. But I'm not going to talk about those here. This post is about my initial thoughts on owning an EV.
EVs Are Fun to Drive
I knew that EVs could produce a great deal of Torque, but I didn't realize how much that impacted the driving experience. The Ioniq 6 can accelerate way faster than I ever need it to. This is useful for merging onto highways and such, but it's also just a lot of fun. I've owned cars with powerful motors, but the instant torque of an EV is a different experience. It's hard to imagine going back to driving a non-EV at this point.
EVs Are Quiet
The only noise that the Ioniq 6's engine makes is a whine that lets pedestrians know the car is nearby. When you turn on the car, the engine makes no noise. None. No ignition sound, no idling; nothing.
Charging At Home Is Nice
The Ioniq 6 includes a "level 1" charger that plugs into a standard 120V outlet. It's pretty slow; it takes about 48 hours to completely charge the battery from empty. But it's probably sufficient for most people's needs. I did have a problem one day when I didn't have enough time to fully charge the car at home before embarking on a long trip, so I had to stop at a charging station. But we'll talk about that in a bit.
Hyundai has a promotion where they will install a "level 2" charger for you, so I now have a "level 2" charger that charges the battery in a few hours.
My car's range is about 200 miles (we'll get to that in a bit), so unless I'm going on a long trip, I can easily charge my car at home. This is super convenient. I never have to go to a gas station. Every time I get in my car at home, it's fully charged and ready to go.
Public Charging Is Not As Convenient As Gas Stations
My car's range is about 200 miles, so for long trips, I need to stop and charge on the way. There are more public chargers than I thought, but they are not as common as gas stations, and they have different speeds. There are extremely fast, DC chargers that can charge a car in minutes, but they are not as common as the slower, level 2 chargers. In theory, my car can be charged in less than 20 minutes. But in practice, I have yet to experience that. Charging speed is greatly effected by temperature, and I have never experienced anything close to that optimal charging speed. The Ioniq 6 has a preconditioning system that is supposed to prepare the battery for high-speed charging by warming it up, but all I can say is that it hasn't worked well for me, and all of my public charging experiences have been significantly longer than 20 minutes.
The longest trip I have taken with my EV has been to Pittsburgh. This trip is largely on the PA turnpike. There are no chargers on the turnpike itself, but there are several DC charging stations a few minutes drive off the turnpike.
When you combine the time it takes to leave the turnpike, and the longer time it takes to charge an EV versus fill the gas tank, the bottom line is that long trips will take longer in an EV. On my first trip, I expected my car to charge in 20 minutes as advertised, and for the trip to take only slightly longer than usual. But it ended up taking me over an hour longer, which was upsetting.
You may have also seen various stories about charger stations having long lines during cold weather. This is a real problem, and it contributes to the unpredictability of long trips in an EV. It should get better over time as charging infrastructure becomes more adequate.
Range Anxiety
There are so many gas stations that in a internal combustion engine (ICE) car, having an exact range to empty is not that important. But because chargers are less prolific, you would think that all EVs would be able to tell you a fairly accurate estimate until empty. Well, that's simply not the case for the Ioniq 6. Battery performance is greatly effected by temperature, and the car's range drops significantly in cold weather. You would hope that the car, or the car's manual, would provide accurate guidance on how far it can go in various conditions. But they do not. Instead, you need to rely on personal experience or external guidance such as these tests from consumer reports.
I think that car manufacturers are shooting themselves in the foot here by not being more transparent. If you are going to advertise that your car has a 270 mile range, then it should have a 270 mile range in all conditions. If it doesn't, then you should be open about that. I think that the lack of transparency is going to make people less likely to buy EVs. The same principle applies to charging times. It's great if the car can charge in 20 minutes under ideal circumstances. But if you don't openly admit that it performs significantly worse in real-world conditions, then you are going to upset your customers.
I've read that Tesla cars can estimate their range very accurately. But I've been on long trips in which I've steadily watched the buffer between my car's remaining range and the distance to the closest charging station decrease in my Ioniq 6. It's not a good feeling at all, and from an engineering point, I think it's inexcusable.
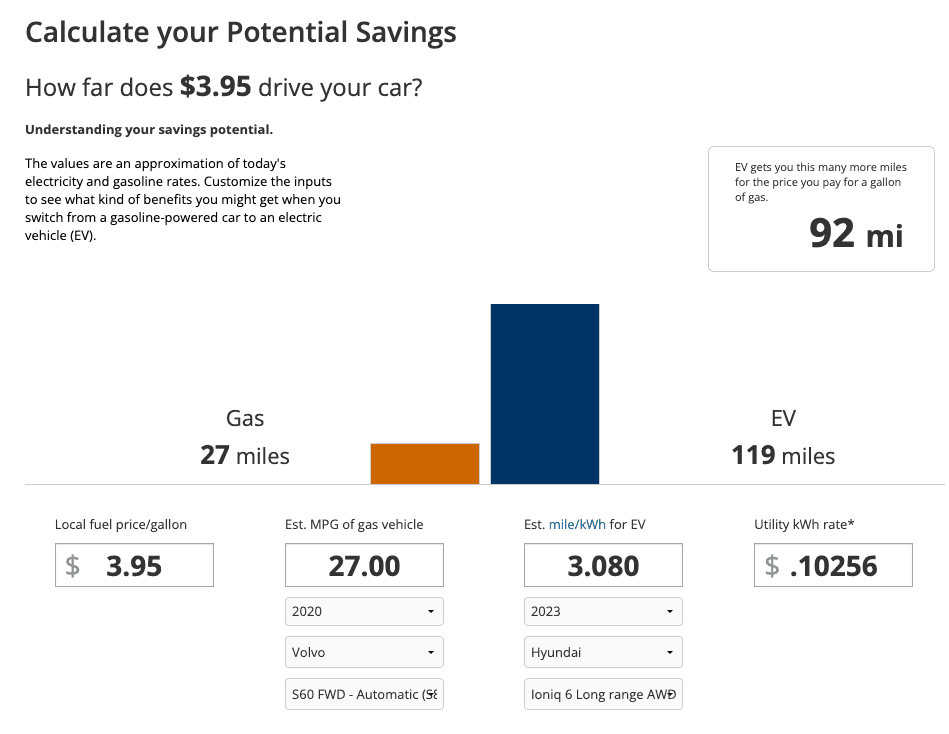
Fuel Cost
Of course, one of the selling points of an EV is that you don't have to buy gas. You do have to pay for electricity, but it's significantly cheaper. Here's a comparison of how many miles I would get out of my Volvo S60 vs. my Hyundai Ioniq 6 for the cost of one gallon of gas. (The S60 actually takes 91+ fuel, so it would cost even more than the $3.95 listed.)
Conclusion
I'm very happy with my decision to lease an EV. I would do so again. But I think that manufacturers' decision to focus only on performance under ideal conditions is a mistake that will ultimately result in more people being leery of buying EVs. I know it has colored my experiences (negatively). My ultimate take away is this: If you are driving long distances in an EV, plan for your trip to take more time. We have a two car household, and I'm not sure that I would be ready to replace both with an EV at this point. But for everything but long trips, I think that EVs are the way to go.
I was playing around with ChatGPT and it came up with this gem:
In the thrilling world of ones and zeros, where the mere thought of assembly code sends shivers down the spines of mere mortals, there exists a unique breed of masochists—reverse engineers. Are you the kind of person who looks at a complex problem and thinks, "Why not make it harder?" If the idea of disassembling convoluted code into something even remotely understandable without any upfront instructions sounds like a fun Tuesday afternoon, then we have the perfect job for you.
Introducing the glamorous world of reverse engineering, where the nightmares of dealing with assembly code, hexadecimal hellscapes, and cryptic comments—or the lack thereof—don't just haunt you in your sleep; they're your 9 to 5. Ever wanted to spend hours, nay, days, unraveling the mysteries of code that was never meant to be understood, like an archeologist deciphering the Rosetta Stone, except what you're translating doesn't want to be translated? Congratulations, your masochistic tendencies can finally pay off.
In this role, you will dive headfirst into the abyss of other people's code, armed with nothing but your wits and perhaps an unhealthy dose of caffeine. You'll experience the unparalleled joy of finally understanding a function's purpose at 3 AM, only to realize it was a decoy. But fear not, for the fruits of your labor are many—aside from the occasional existential crisis. You'll gain the satisfaction of knowing you're outsmarting attempts to keep you out, one painstaking line at a time.
So, if you're someone who relishes the thought of your brain being tied into knots by assembly language, who finds the idea of decrypting software protections better than a crossword puzzle on a Sunday morning, and who sees a "No Trespassing" sign as a personal invitation, then the lucrative world of reverse engineering awaits. Where else can you get paid for indulging in your penchant for digital masochism? Join us, and turn your nightmares into your day job.
Ready to sign up? 🤣
I saw a quote in a recent ACM article that resonated with me:
Security must be a business enabler, not a hinderer.
The article is about product development, but the quote is applicable to IT security as well. Too often, IT departments forget what their purpose is, which is to support the mission of the organization. Security is a means to that end, not an end in itself. The goal of IT security is not to eliminate risk. The most secure computer is one that is not plugged in, but that doesn't really help us, does it? The goal of IT security is to manage risk so that the organization can achieve its mission. Unfortunately, it's significantly easier to just say "No, you can't do that because it would increase our risk" instead of "Let me fully understand why you need or want to do that, have a discussion about the security risks that will impose, and collaboratively make a decision that balances the risks and rewards for the organization."
I'm not saying that we should be cavalier about security. After all, I'm personally passionate about security. But we should be intentional about how and where we apply security when it impacts the mission, which is almost always!
I suspect a lot of people would be surprised at the (relatively low) level of security I employ personally. It's not that I'm lazy or incompetent. It's that I've made a conscious decision to accept certain risks in order to achieve certain rewards. For example, I don't bother trying to defend against nation state adversaries. I'm not a high value target. I don't have the resources (time) to defend against a nation state. I'd rather be nimble and flexible in my work capabilities, so I focus on the easy, low-hanging-fruit mitigations that will stop most (but not all) attackers.
Imagine that you reverse engineered a piece of malware in pain-staking detail, only to find that the malware author created a slightly modified version of the malware the next day. You wouldn't want to redo all your hard work. One way to avoid this is to use code comparison techniques to try to identify pairs of functions in the old and new version that are "the same" (which I put in quotes because it's a bit of a nebulous concept, as we'll see).
There are several tools to help in such situations. A very popular (formerly) commercial tool is zynamics' bindiff, which is now owned by Google and free. CMU SEI's Pharos also includes a code comparison utility called fn2hash, which is the subject of this blog post.
Background
Exact Hashing
fn2hash employs several types of hashing, with the most commonly used one called PIC hashing, where PIC stands for Position Independent Code. To see why PIC hashing is important, we'll actually start by looking at a naive precursor to PIC hashing, which is to simply hash the instruction bytes of a function. We'll call this exact hashing.
Let's look at an example. I compiled this simple program
oo.cpp with
g++. Here's the beginning of the assembly code for the function myfunc
(full
code):
Assembly code and bytes from oo.gcc
;;;;;;;;;;;;;;;;;;;;;;;;;;;;;;;;;;;;;;;;;;;;;;;;;;;;;;;;;;;;;;;;;;;;;;;;;;;;;;;;;;;;;;;;;;;;;;;;;;;;;;;;;;;;;;;;;;;;;;;;
;;; function 0x00401200 "myfunc()"
;;; mangled name is "_Z6myfuncv"
;;; reasons for function: referenced by symbol table

;; predecessor:  from instruction 0x004010f4 from basic block 0x004010f0
0x00401200: 41 56                      00 push     r140x00401202: bf 60 00 00 00            -08 mov      edi, 0x00000060<96>
0x00401207: 41 55                     -08 push     r13
0x00401209: 41 54                     -10 push     r12
0x0040120b: 55                        -18 push     rbp
0x0040120c: 48 83 ec 08               -20 sub      rsp, 8
0x00401210: e8 bb fe ff ff            -28 call     function 0x004010d0 "operator new(unsigned long)@plt"
Exact Bytes
In the first highlighted line, you can see that the first instruction is a
push r14, which is encoded by the instruction bytes 41 56. If we collect the
encoded instruction bytes for every instruction in the function, we get:
Exact bytes in oo.gcc
4156BF6000000041554154554883EC08E8BBFEFFFFBF6000000048C700F02040004889C548C7401010214000C740582A000000E898FEFFFFBF1000000048C700F02040004989C448C7401010214000C740582A000000E875FEFFFFBA0D000000BE48204000BF80404000C74008000000004989C5C6400C0048C700D8204000E82CFEFFFF488B05F52D0000488B40E84C8BB0704140004D85F60F842803000041807E38000F84160200004C89F7E898FBFFFF498B06BE0A000000488B4030483DD01540000F84CFFDFFFF4C89F7FFD00FBEF0E9C2FDFFFF410FBE7643BF80404000E827FEFFFF4889C7E8FFFDFFFF488B4500488B00483DE01740000F85AC0200004889EFFFD0488B4500488B4008483D601640000F84A0FDFFFFBA0D000000BE3A204000BF80404000E8C8FDFFFF488B05912D0000488B40E84C8BB0704140004D85F60F84C402000041807E38000F84820100004C89F7E8C8FBFFFF498B06BE0A000000488B4030483DD01540000F8463FEFFFF4C89F7FFD00FBEF0E956FEFFFF410FBE7643BF80404000E8C3FDFFFF4889C7E89BFDFFFF488B4500488B4008483D601640000F85600200004889EFFFD0E9E7FDFFFFBA0D000000BE1E204000BF80404000E863FDFFFF488B052C2D0000488B40E84C8BB0704140004D85F60F845F02000041807E38000F847D0100004C89F7E868FBFFFF498B06BE0A000000488B4030483DD01540000F8468FEFFFF4C89F7FFD00FBEF0E95BFEFFFF410FBE7643BF80404000E85EFDFFFF4889C7E836FDFFFF488B4510488D7D10488B4008483DE01540000F8506020000FFD0498B0424488B00483DE01740000F8449FEFFFFBA0D000000BE10204000BF80404000E8FAFCFFFF488B05C32C0000488B40E84C8BB0704140004D85F60F84F601000041807E38000F84440100004C89F7E838FBFFFF498B06BE0A000000488B4030483DD01540000F84A1FEFFFF4C89F7FFD00FBEF0E994FEFFFF410FBE7643BF80404000E8F5FCFFFF4889C7E8CDFCFFFF498B0424488B00483DE01740000F85B70100004C89E7FFD0E990FEFFFFBA0D000000BE3A204000BF80404000E896FCFFFF488B055F2C0000488B40E84C8BB0704140004D85F60F8492010000E864FAFFFF0F1F400041807E38000F84100100004C89F7E808FBFFFF498B06BE0A000000488B4030483DD01540000F84D5FEFFFF4C89F7FFD00FBEF0E9C8FEFFFF410FBE7643BF80404000E891FCFFFF4889C7E869FCFFFF4889EFBE60000000E8FC0300004C89E7BE10000000E8EF0300004883C4084C89EFBE100000005D415C415D415EE9D7030000We call this sequence the exact bytes of the function. We can hash these bytes to get an exact hash, 62CE2E852A685A8971AF291244A1283A.
Short-comings of Exact Hashing
The highlighted call at address 0x401210 is a relative call, which means that
the target is specified as an offset from the current instruction (well,
technically the next instruction). If you look at the instruction bytes for this
instruction, it includes the bytes bb fe ff ff, which is 0xfffffebb in little
endian form; interpreted as a signed integer value, this is -325. If we take
the address of the next instruction (0x401210 + 5 == 0x401215) and then add -325
to it, we get 0x4010d0, which is the address of operator new, the target of
the call. Yay. So now we know that bb fe ff ff is an offset from the next
instruction. Such offsets are called relative offsets because they are
relative to the address of the next instruction.
I created a slightly modified
program (oo2.gcc) by
adding an empty, unused function before myfunc. You can find the disassembly
of myfunc for this executable
here.
If we take the exact hash of myfunc in this new executable, we get
05718F65D9AA5176682C6C2D5404CA8D. Wait, that's different than the hash for
myfunc in the first executable, 62CE2E852A685A8971AF291244A1283A. What
happened? Let's look at the disassembly.
Assembly code and bytes from oo2.gcc
;;;;;;;;;;;;;;;;;;;;;;;;;;;;;;;;;;;;;;;;;;;;;;;;;;;;;;;;;;;;;;;;;;;;;;;;;;;;;;;;;;;;;;;;;;;;;;;;;;;;;;;;;;;;;;;;;;;;;;;;
;;; function 0x00401210 "myfunc()"

;; predecessor:  from instruction 0x004010f4 from basic block 0x004010f0
0x00401210: 41 56                      00 push     r14
0x00401212: bf 60 00 00 00            -08 mov      edi, 0x00000060<96>
0x00401217: 41 55                     -08 push     r13
0x00401219: 41 54                     -10 push     r12
0x0040121b: 55                        -18 push     rbp
0x0040121c: 48 83 ec 08               -20 sub      rsp, 8
0x00401220: e8 ab fe ff ff            -28 call     function 0x004010d0 "operator new(unsigned long)@plt"
Notice that myfunc moved from 0x401200 to 0x401210, which also moved the
address of the call instruction from 0x401210 to 0x401220. Because the call
target is specified as an offset from the (next) instruction's address, which
changed by 0x10 == 16, the offset bytes for the call changed from bb fe ff ff
(-325) to ab fe ff ff (-341 == -325 - 16). These changes modify the exact
bytes to:
Exact bytes in oo2.gcc
4156BF6000000041554154554883EC08E8ABFEFFFFBF6000000048C700F02040004889C548C7401010214000C740582A000000E888FEFFFFBF1000000048C700F02040004989C448C7401010214000C740582A000000E865FEFFFFBA0D000000BE48204000BF80404000C74008000000004989C5C6400C0048C700D8204000E81CFEFFFF488B05E52D0000488B40E84C8BB0704140004D85F60F842803000041807E38000F84160200004C89F7E888FBFFFF498B06BE0A000000488B4030483DE01540000F84CFFDFFFF4C89F7FFD00FBEF0E9C2FDFFFF410FBE7643BF80404000E817FEFFFF4889C7E8EFFDFFFF488B4500488B00483DF01740000F85AC0200004889EFFFD0488B4500488B4008483D701640000F84A0FDFFFFBA0D000000BE3A204000BF80404000E8B8FDFFFF488B05812D0000488B40E84C8BB0704140004D85F60F84C402000041807E38000F84820100004C89F7E8B8FBFFFF498B06BE0A000000488B4030483DE01540000F8463FEFFFF4C89F7FFD00FBEF0E956FEFFFF410FBE7643BF80404000E8B3FDFFFF4889C7E88BFDFFFF488B4500488B4008483D701640000F85600200004889EFFFD0E9E7FDFFFFBA0D000000BE1E204000BF80404000E853FDFFFF488B051C2D0000488B40E84C8BB0704140004D85F60F845F02000041807E38000F847D0100004C89F7E858FBFFFF498B06BE0A000000488B4030483DE01540000F8468FEFFFF4C89F7FFD00FBEF0E95BFEFFFF410FBE7643BF80404000E84EFDFFFF4889C7E826FDFFFF488B4510488D7D10488B4008483DF01540000F8506020000FFD0498B0424488B00483DF01740000F8449FEFFFFBA0D000000BE10204000BF80404000E8EAFCFFFF488B05B32C0000488B40E84C8BB0704140004D85F60F84F601000041807E38000F84440100004C89F7E828FBFFFF498B06BE0A000000488B4030483DE01540000F84A1FEFFFF4C89F7FFD00FBEF0E994FEFFFF410FBE7643BF80404000E8E5FCFFFF4889C7E8BDFCFFFF498B0424488B00483DF01740000F85B70100004C89E7FFD0E990FEFFFFBA0D000000BE3A204000BF80404000E886FCFFFF488B054F2C0000488B40E84C8BB0704140004D85F60F8492010000E854FAFFFF0F1F400041807E38000F84100100004C89F7E8F8FAFFFF498B06BE0A000000488B4030483DE01540000F84D5FEFFFF4C89F7FFD00FBEF0E9C8FEFFFF410FBE7643BF80404000E881FCFFFF4889C7E859FCFFFF4889EFBE60000000E8FC0300004C89E7BE10000000E8EF0300004883C4084C89EFBE100000005D415C415D415EE9D7030000You can look through that and see the differences by eyeballing it. Just kidding! Here's a visual comparison. Red represents bytes that are only in oo.gcc, and green represents bytes in oo2.gcc. The differences are small because the offset is only changing by 0x10, but this is enough to break exact hashing.
Difference between exact bytes in oo.gcc and oo2.gcc
4156BF6000000041554154554883EC08E8BBABFEFFFFBF6000000048C700F02040004889C548C7401010214000C740582A000000E89888FEFFFFBF1000000048C700F02040004989C448C7401010214000C740582A000000E87565FEFFFFBA0D000000BE48204000BF80404000C74008000000004989C5C6400C0048C700D8204000E82C1CFEFFFF488B05F5E52D0000488B40E84C8BB0704140004D85F60F842803000041807E38000F84160200004C89F7E89888FBFFFF498B06BE0A000000488B4030483DD0E01540000F84CFFDFFFF4C89F7FFD00FBEF0E9C2FDFFFF410FBE7643BF80404000E82717FEFFFF4889C7E8FFEFFDFFFF488B4500488B00483DE0F01740000F85AC0200004889EFFFD0488B4500488B4008483D60701640000F84A0FDFFFFBA0D000000BE3A204000BF80404000E8C8B8FDFFFF488B0591812D0000488B40E84C8BB0704140004D85F60F84C402000041807E38000F84820100004C89F7E8C8B8FBFFFF498B06BE0A000000488B4030483DD0E01540000F8463FEFFFF4C89F7FFD00FBEF0E956FEFFFF410FBE7643BF80404000E8C3B3FDFFFF4889C7E89B8BFDFFFF488B4500488B4008483D60701640000F85600200004889EFFFD0E9E7FDFFFFBA0D000000BE1E204000BF80404000E86353FDFFFF488B052C1C2D0000488B40E84C8BB0704140004D85F60F845F02000041807E38000F847D0100004C89F7E86858FBFFFF498B06BE0A000000488B4030483DD0E01540000F8468FEFFFF4C89F7FFD00FBEF0E95BFEFFFF410FBE7643BF80404000E85E4EFDFFFF4889C7E83626FDFFFF488B4510488D7D10488B4008483DE0F01540000F8506020000FFD0498B0424488B00483DE0F01740000F8449FEFFFFBA0D000000BE10204000BF80404000E8FAEAFCFFFF488B05C3B32C0000488B40E84C8BB0704140004D85F60F84F601000041807E38000F84440100004C89F7E83828FBFFFF498B06BE0A000000488B4030483DD0E01540000F84A1FEFFFF4C89F7FFD00FBEF0E994FEFFFF410FBE7643BF80404000E8F5E5FCFFFF4889C7E8CDBDFCFFFF498B0424488B00483DE0F01740000F85B70100004C89E7FFD0E990FEFFFFBA0D000000BE3A204000BF80404000E89686FCFFFF488B055F4F2C0000488B40E84C8BB0704140004D85F60F8492010000E86454FAFFFF0F1F400041807E38000F84100100004C89F7E808FBF8FAFFFF498B06BE0A000000488B4030483DD0E01540000F84D5FEFFFF4C89F7FFD00FBEF0E9C8FEFFFF410FBE7643BF80404000E89181FCFFFF4889C7E86959FCFFFF4889EFBE60000000E8FC0300004C89E7BE10000000E8EF0300004883C4084C89EFBE100000005D415C415D415EE9D7030000
PIC Hashing
This problem is the motivation for few different types of hashing that we'll
talk about in this blog post, including PIC hashing and fuzzy hashing. The
PIC in PIC hashing stands for Position Independent Code. At a high level,
the goal of PIC hashing is to compute a hash or signature of code, but do so in
a way that relocating the code will not change the hash. This is important
because, as we just saw, modifying a program often results in small changes to
addresses and offsets and we don't want these changes to modify the hash!. The
intuition behind PIC hashing is very straight-forward: identify offsets and
addresses that are likely to change if the program is recompiled, such as bb fe ff ff,
and simply set them to zero before hashing the bytes. That way if they
change because the function is relocated, the function's PIC hash won't change.
The following visual diff shows the differences between the exact bytes and the
PIC bytes on myfunc in oo.gcc. Red represents bytes that are only in the PIC
bytes, and green represents the exact bytes. As expected, the first
change we can see is the byte sequence bb fe ff ff, which is changed to zeros.
Byte difference between PIC bytes (red) and exact bytes (green)
4156BF6000000041554154554883EC08E800000000BBFEFFFFBF6000000048C700000000F02040004889C548C7401000000010214000C740582A000000E80000000098FEFFFFBF1000000048C700000000F02040004989C448C7401000000010214000C740582A000000E80000000075FEFFFFBA0D000000BE00000048204000BF00000080404000C74008000000004989C5C6400C0048C700000000D8204000E8000000002CFEFFFF488B050000F52D0000488B40E84C8BB0000000704140004D85F60F842803000041807E38000F84160200004C89F7E80000000098FBFFFF498B06BE0A000000488B4030483D000000D01540000F84CFFDFFFF4C89F7FFD00FBEF0E9C2FDFFFF410FBE7643BF00000080404000E80000000027FEFFFF4889C7E800000000FFFDFFFF488B4500488B00483D000000E01740000F85AC0200004889EFFFD0488B4500488B4008483D000000601640000F84A0FDFFFFBA0D000000BE0000003A204000BF00000080404000E800000000C8FDFFFF488B050000912D0000488B40E84C8BB0000000704140004D85F60F84C402000041807E38000F84820100004C89F7E800000000C8FBFFFF498B06BE0A000000488B4030483D000000D01540000F8463FEFFFF4C89F7FFD00FBEF0E956FEFFFF410FBE7643BF00000080404000E800000000C3FDFFFF4889C7E8000000009BFDFFFF488B4500488B4008483D000000601640000F85600200004889EFFFD0E9E7FDFFFFBA0D000000BE0000001E204000BF00000080404000E80000000063FDFFFF488B0500002C2D0000488B40E84C8BB0000000704140004D85F60F845F02000041807E38000F847D0100004C89F7E80000000068FBFFFF498B06BE0A000000488B4030483D000000D01540000F8468FEFFFF4C89F7FFD00FBEF0E95BFEFFFF410FBE7643BF00000080404000E8000000005EFDFFFF4889C7E80000000036FDFFFF488B4510488D7D10488B4008483D000000E01540000F8506020000FFD0498B0424488B00483D000000E01740000F8449FEFFFFBA0D000000BE00000010204000BF00000080404000E800000000FAFCFFFF488B050000C32C0000488B40E84C8BB0000000704140004D85F60F84F601000041807E38000F84440100004C89F7E80000000038FBFFFF498B06BE0A000000488B4030483D000000D01540000F84A1FEFFFF4C89F7FFD00FBEF0E994FEFFFF410FBE7643BF00000080404000E800000000F5FCFFFF4889C7E800000000CDFCFFFF498B0424488B00483D000000E01740000F85B70100004C89E7FFD0E990FEFFFFBA0D000000BE0000003A204000BF00000080404000E80000000096FCFFFF488B0500005F2C0000488B40E84C8BB0000000704140004D85F60F8492010000E80000000064FAFFFF0F1F400041807E38000F84100100004C89F7E80000000008FBFFFF498B06BE0A000000488B4030483D000000D01540000F84D5FEFFFF4C89F7FFD00FBEF0E9C8FEFFFF410FBE7643BF00000080404000E80000000091FCFFFF4889C7E80000000069FCFFFF4889EFBE60000000E80000FC0300004C89E7BE10000000E80000EF0300004883C4084C89EFBE100000005D415C415D415EE90000D7030000
If we hash the PIC bytes, we get the PIC hash
EA4256ECB85EDCF3F1515EACFA734E17. And, as we would hope, we get the same PIC
hash for myfunc in the slightly modified oo2.gcc.
Evaluating the Accuracy of PIC Hashing
The primary motivation behind PIC hashing is to detect identical code that is moved to a different location. But what if two pieces of code are compiled with different compilers or different compiler flags? What if two functions are very similar, but one has a line of code removed? Because these changes would modify the non-offset bytes that are used in the PIC hash, it would change the PIC hash of the code. Since we know that PIC hashing will not always work, in this section we'll discuss how we can measure the performance of PIC hashing and compare it to other code comparison techniques.
Before we can define the accuracy of any code comparison technique, we'll need some ground truth that tells us which functions are equivalent. For this blog post, we'll use compiler debug symbols to map function addresses to their names. This will provide us with a ground truth set of functions and their names. For the purposes of this blog post, and general expediency, we'll assume that if two functions have the same name, they are "the same". (This obviously is not true in general!)
Confusion Matrices
So, let's say we have two similar executables, and we want to evaluate how well PIC hashing can identify equivalent functions across both executables. We'll start by considering all possible pairs of functions, where each pair contains a function from each executable. If we're being mathy, this is called the cartesian product (between the functions in the first executable and the functions in the second executable). For each function pair, we'll use the ground truth to determine if the functions are the same by seeing if they have the same name. Then we'll use PIC hashing to predict whether the functions are the same by computing their hashes and seeing if they are identical. There are two outcomes for each determination, so there are four possibilities in total:
- True Positive (TP): PIC hashing correctly predicted the functions are equivalent.
- True Negative (TN): PIC hashing correctly predicted the functions are different.
- False Positive (FP): PIC hashing incorrectly predicted the functions are equivalent, but they are not.
- False Negative (FN): PIC hashing incorrectly predicted the functions are different, but they are equivalent.
To make it a little easier to interpret, we color the good outcomes green and the bad outcomes red.
We can represent these in what is called a confusion matrix:
| Hashing says same | Hashing says different | |
|---|---|---|
| Ground truth says same | TP | FN |
| Ground truth says different | FP | TN |
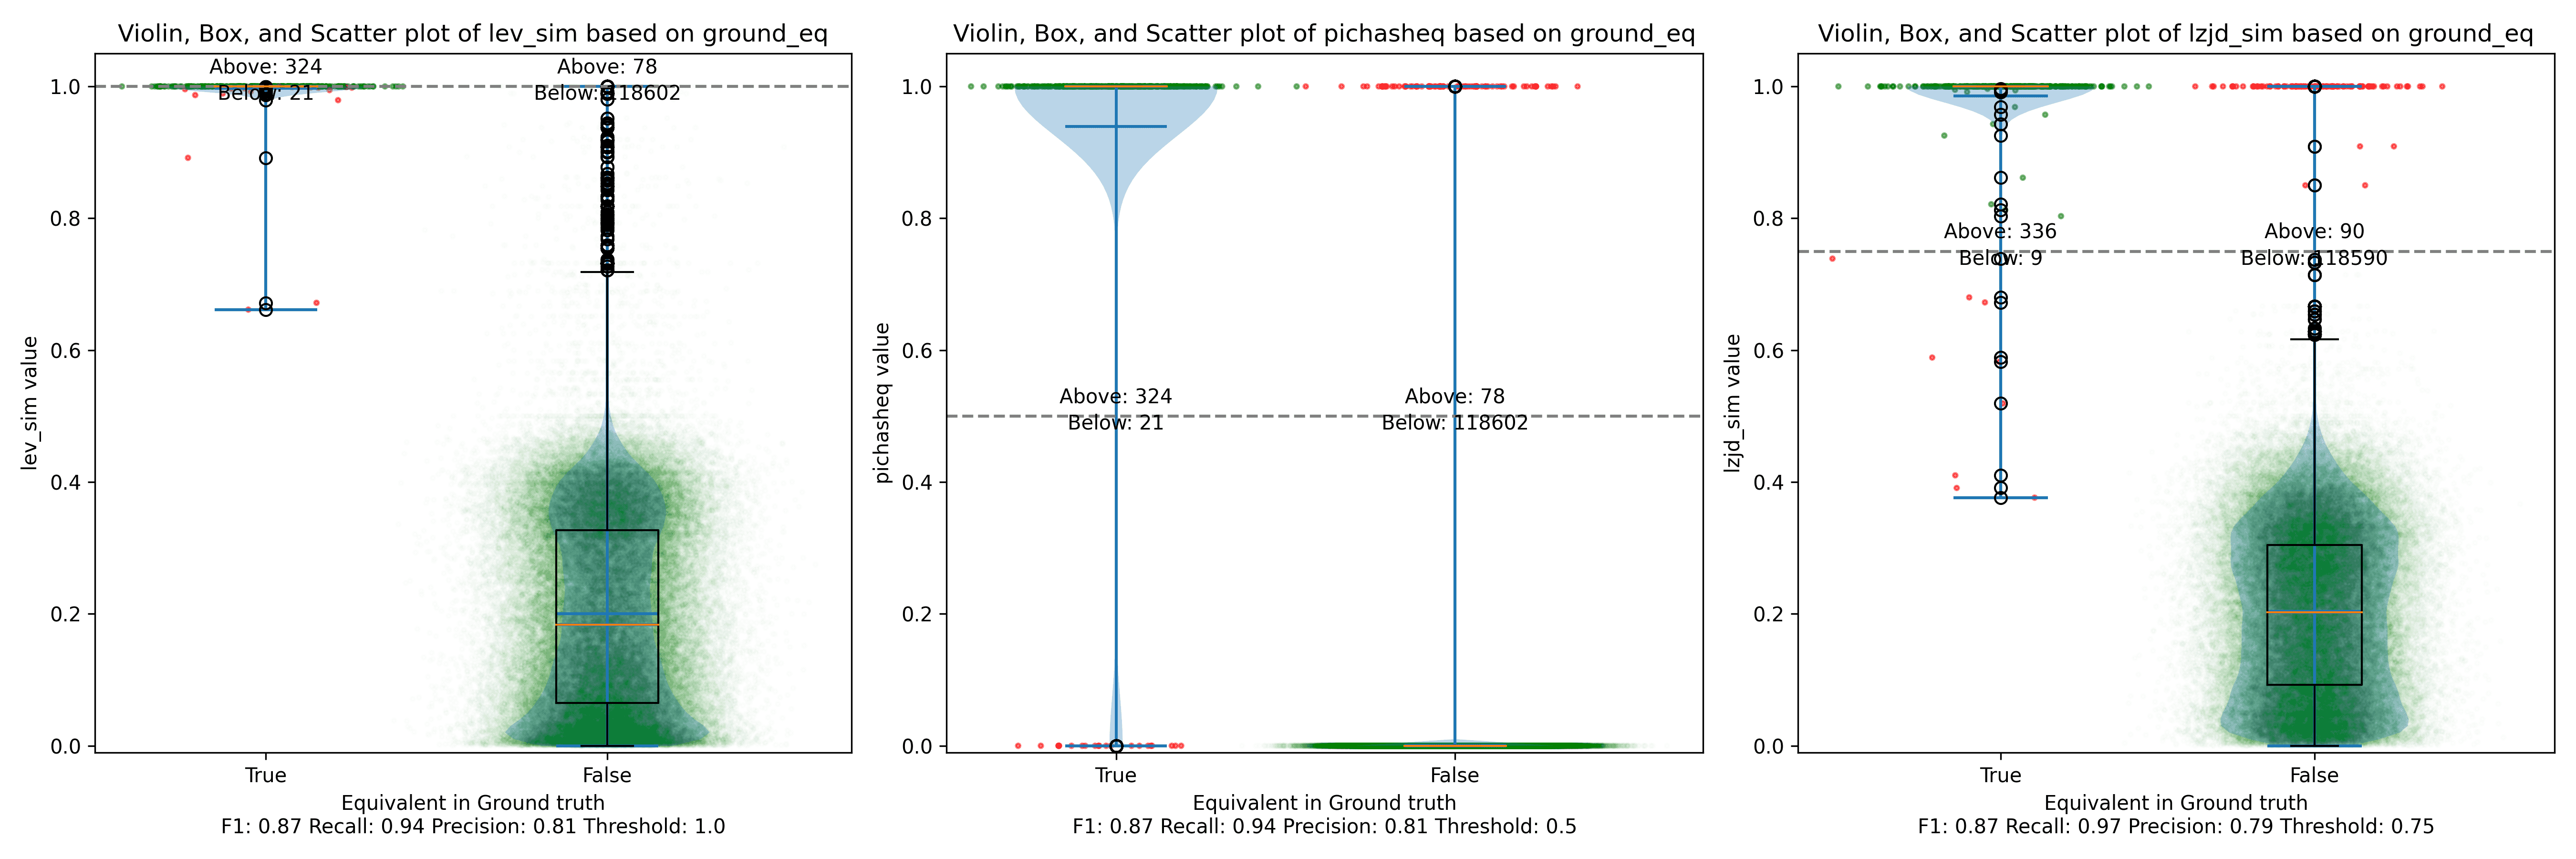
For example, here is a confusion matrix from an experiment where I use PIC hashing to compare openssl versions 1.1.1w and 1.1.1v when they are both compiled in the same manner. These two versions of openssl are very similar, so we would expect that PIC hashing would do well because a lot of functions will be identical but shifted to different addresses. And, indeed, it does:
| Hashing says same | Hashing says different | |
|---|---|---|
| Ground truth says same | 344 | 1 |
| Ground truth says different | 78 | 118,602 |
Metrics: Accuracy, Precision, and Recall
So when does PIC hashing work well, and when does it not? In order to answer these questions, we're going to need an easier way to evaluate the quality of a confusion matrix as a single number. At first glance, accuracy seems like the most natural metric, which tell us: How many pairs did hashing predict correctly? This is equal to
For the above example, PIC hashing achieved an accuracy of
99.9% accuracy. Pretty good, right?
But if you look closely, there's a subtle problem. Most function pairs are not equivalent. According to the ground truth, there are equivalent function pairs, and non-equivalent function pairs. So, if we just guessed that all function pairs were non-equivalent, we would still be right of the time. Since accuracy weights all function pairs equally, it is not the best metric here.
Instead, we want a metric that emphasizes positive results, which in this case are equivalent function pairs. This is consistent with our goal in reverse engineering, because knowing that two functions are equivalent allows a reverse engineer to transfer knowledge from one executable to another and save time!
Three metrics that focus more on positive cases (i.e., equivalent functions) are precision, recall, and F1 score:
- Precision: Of the function pairs hashing declared equivalent, how many were actually equivalent? This is equal to .
- Recall: Of the equivalent function pairs, how many did hashing correctly declare as equivalent? This is equal to .
- F1 score: This is a single metric that reflects both the Precision and Recall. Specifically, it is the harmonic mean of the Precision and Recall, or . Compared to the arithmetic mean, the harmonic mean is more sensitive to low values. This means that if either Precision or Recall is low, the F1 score will also be low.
So, looking at the above example, we can compute the precision, recall, and F1 score. The precision is , the recall is , and the F1 score is . So, PIC hashing is able to identify 81% of equivalent function pairs, and when it does declare a pair is equivalent, it is correct 99.7% of the time. This corresponds to a F1 score of 0.89 out of 1.0, which is pretty good!
Now, you might be wondering how well PIC hashing performs when the differences between executables are larger.
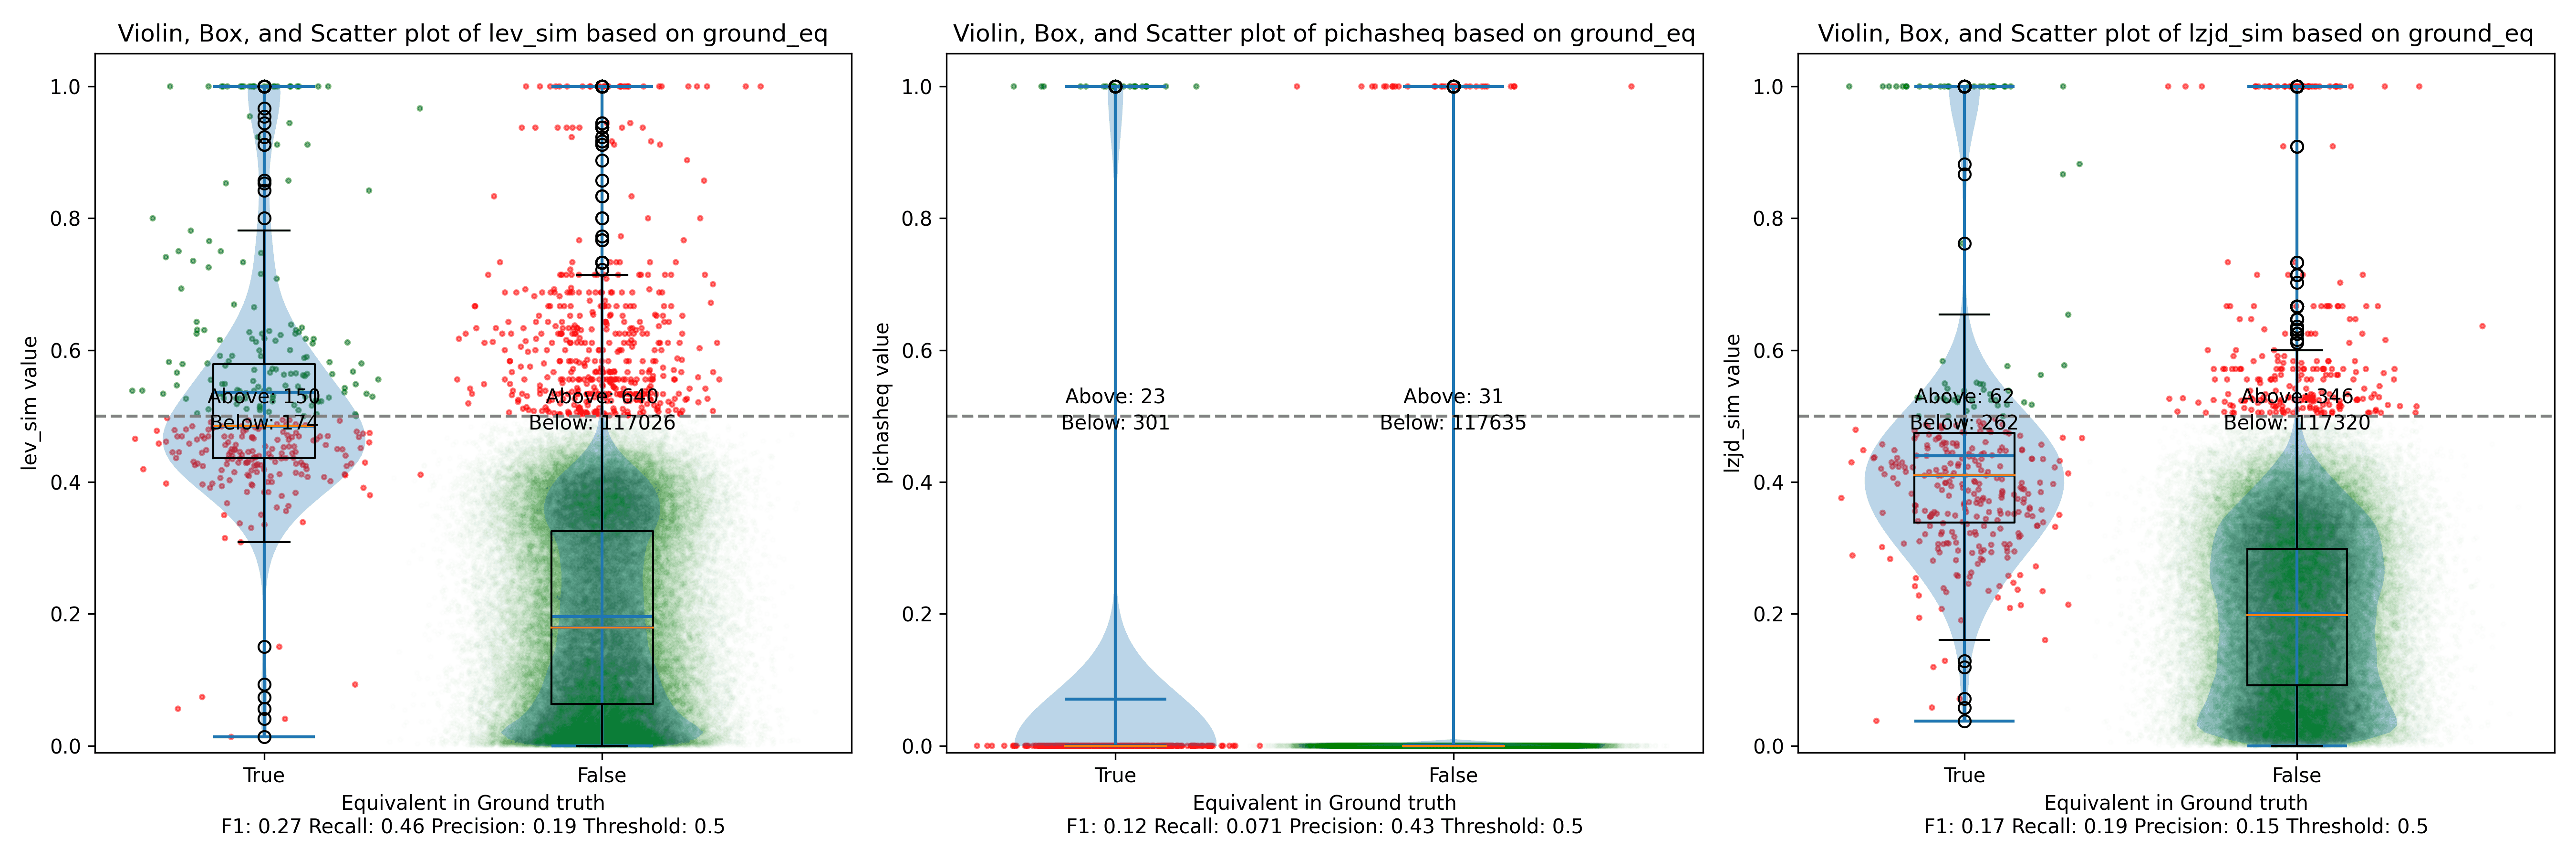
Let's look at another experiment. In this one, I compare an openssl executable compiled with gcc to one compiled with clang. Because gcc and clang generate assembly code differently, we would expect there to be a lot more differences.
Here is a confusion matrix from this experiment:
| Hashing says same | Hashing says different | |
|---|---|---|
| Ground truth says same | 23 | 301 |
| Ground truth says different | 31 | 117,635 |
In this example, PIC hashing achieved a recall of , and a precision of . So, hashing is only able to identify 7% of equivalent function pairs, but when it does declare a pair is equivalent, it is correct 43% of the time. This corresponds to a F1 score of 0.12 out of 1.0, which is pretty bad. Imagine that you spent hours reverse engineering the 324 functions in one of the executables, only to find that PIC hashing was only able to identify 23 of them in the other executable, so you would be forced to needlessly reverse engineer the other functions from scratch. That would be pretty frustrating! Can we do better?
The Great Fuzzy Hashing Debate
There's a very different type of hashing called fuzzy hashing. Like regular
hashing, there is a hash function that reads a sequence of bytes and produces a hash.
Unlike regular hashing, though, you don't compare fuzzy hashes with equality.
Instead, there is a similarity function which takes two fuzzy hashes as input,
and returns a number between 0 and 1, where 0 means completely dissimilar, and 1
means completely similar.
My colleague, Cory Cohen, and I, actually debated whether there is utility in applying fuzzy hashes to instruction bytes, and our debate motivated this blog post. I thought there would be a benefit, but Cory felt there would not. Hence these experiments! For this blog post, I'll be using the Lempel-Ziv Jaccard Distance fuzzy hash, or just LZJD for short, because it's very fast. Most fuzzy hash algorithms are pretty slow. In fact, learning about LZJD is what motivated our debate. The possibility of a fast fuzzy hashing algorithm opens up the possibility of using fuzzy hashes to search for similar functions in a large database and other interesting possibilities.
I'll also be using Levenshtein distance as a baseline. Levenshtein distance is a measure of how many changes you need to make to one string to transform it to another. For example, the Levenshtein distance between "cat" and "bat" is 1, because you only need to change the first letter. Levenshtein distance allows us to define an optimal notion of similarity at the instruction byte level. The trade-off is that it's really slow, so it's only really useful as a baseline in our experiments.
Experiments
To test the accuracy of PIC hashing under various scenarios, I defined a few experiments. Each experiment takes a similar (or identical) piece of source code and compiles it, sometimes with different compilers or flags.
Experiment 1: openssl 1.1.1w
In this experiment, I compiled openssl 1.1.1w in a few different ways. In each
case, I examined the resulting openssl executable.
Experiment 1a: openssl1.1.1w Compiled With Different Compilers
In this first experiment, I compiled openssl 1.1.1w with gcc -O3 -g and clang
-O3 -g and compared the results. We'll start with the confusion matrix for PIC
hashing:
| Hashing says same | Hashing says different | |
|---|---|---|
| Ground truth says same | 23 | 301 |
| Ground truth says different | 31 | 117,635 |
As we saw earlier, this results in a recall of 0.07, a precision of 0.45, and a F1 score of 0.12. To summarize: pretty bad.
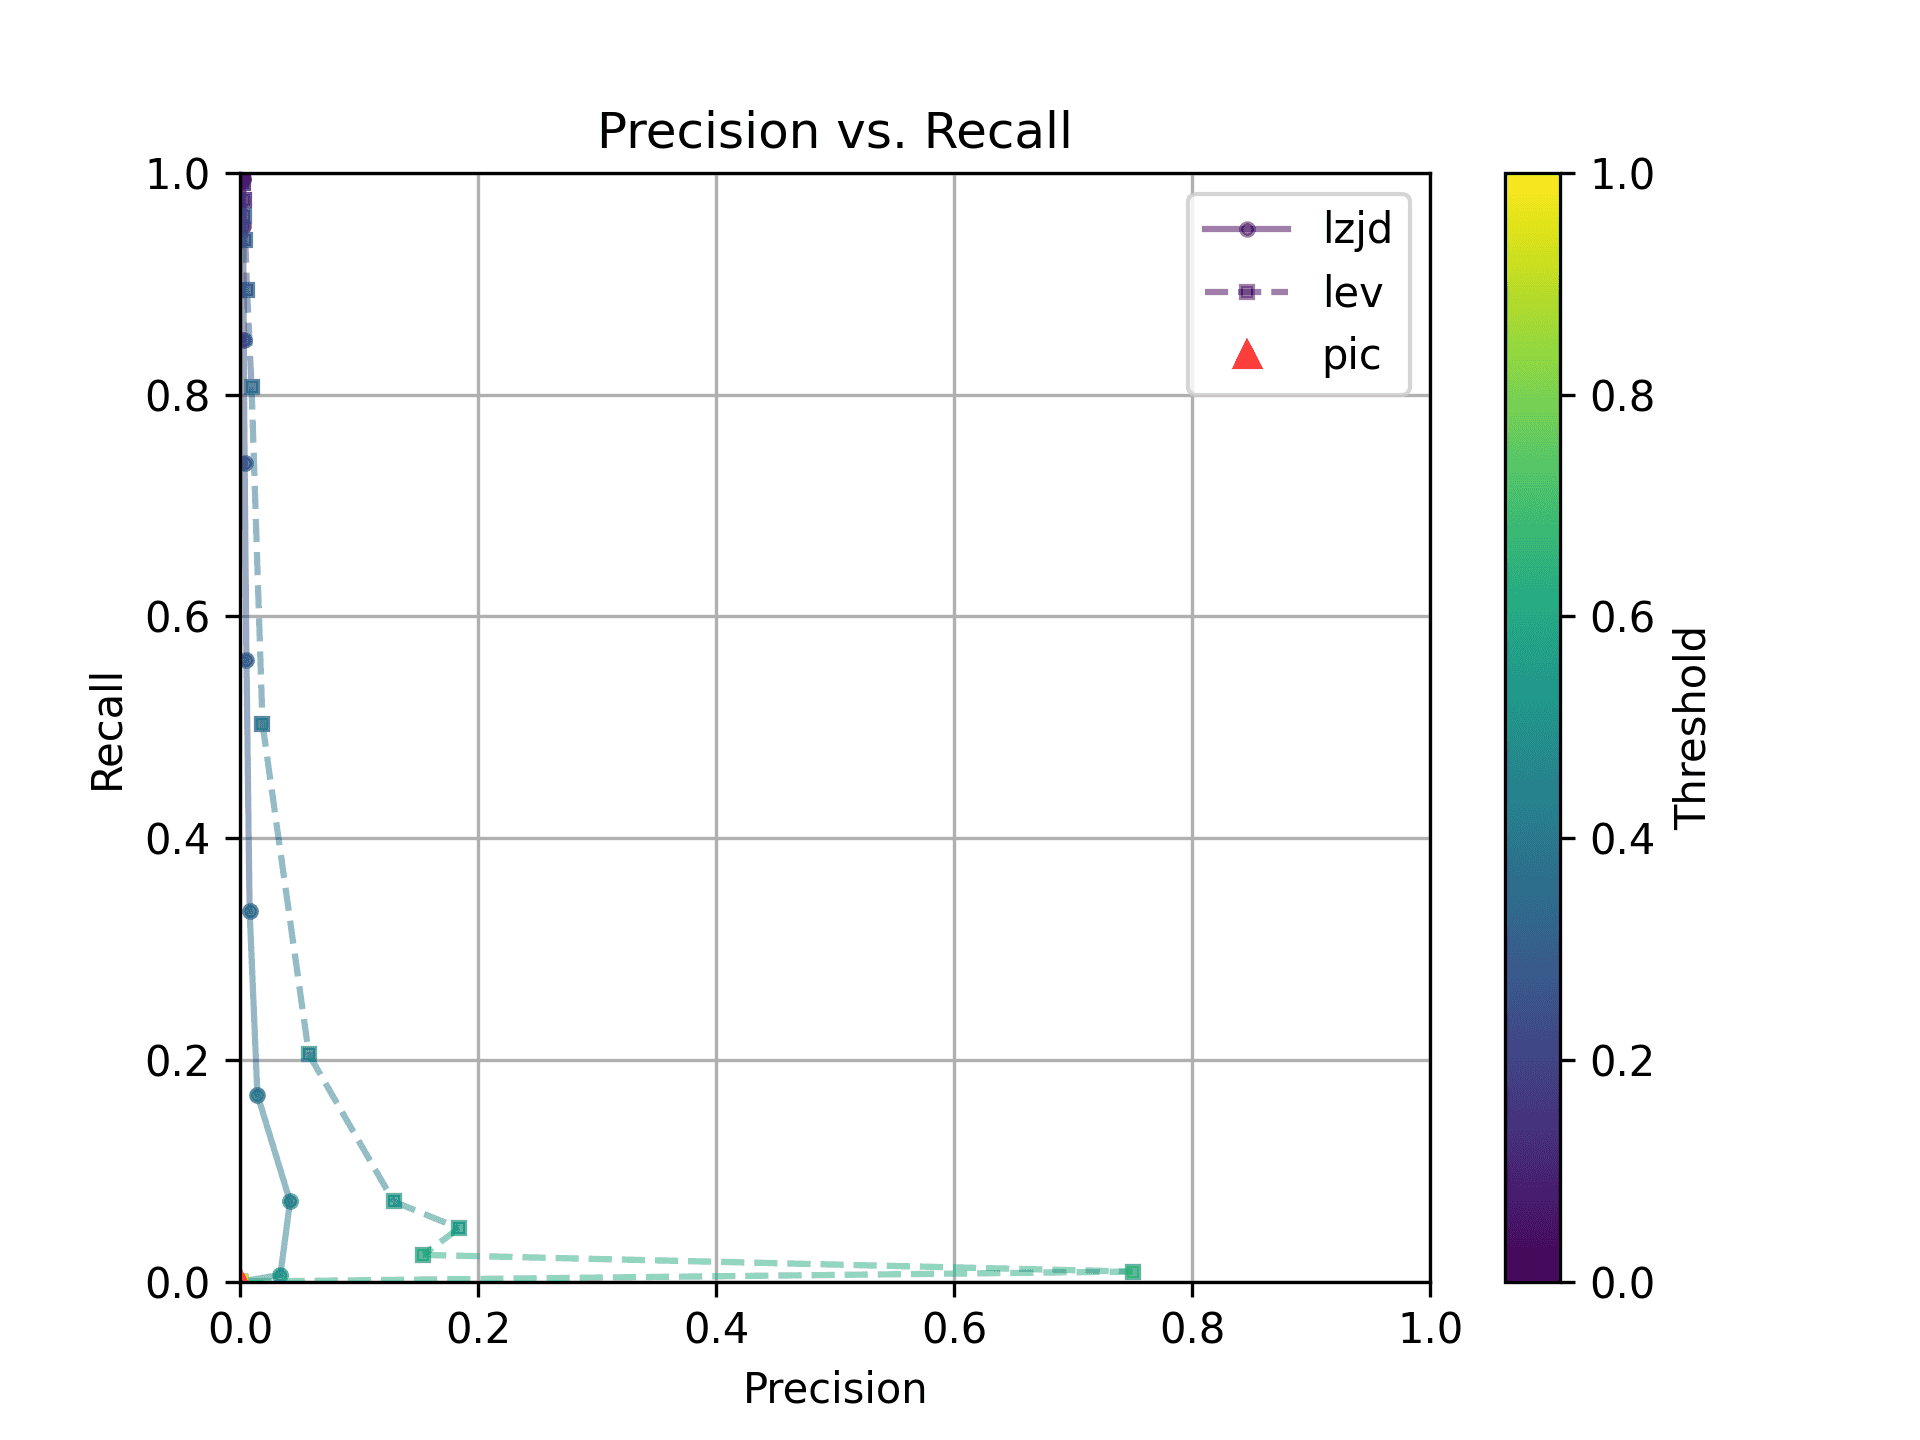
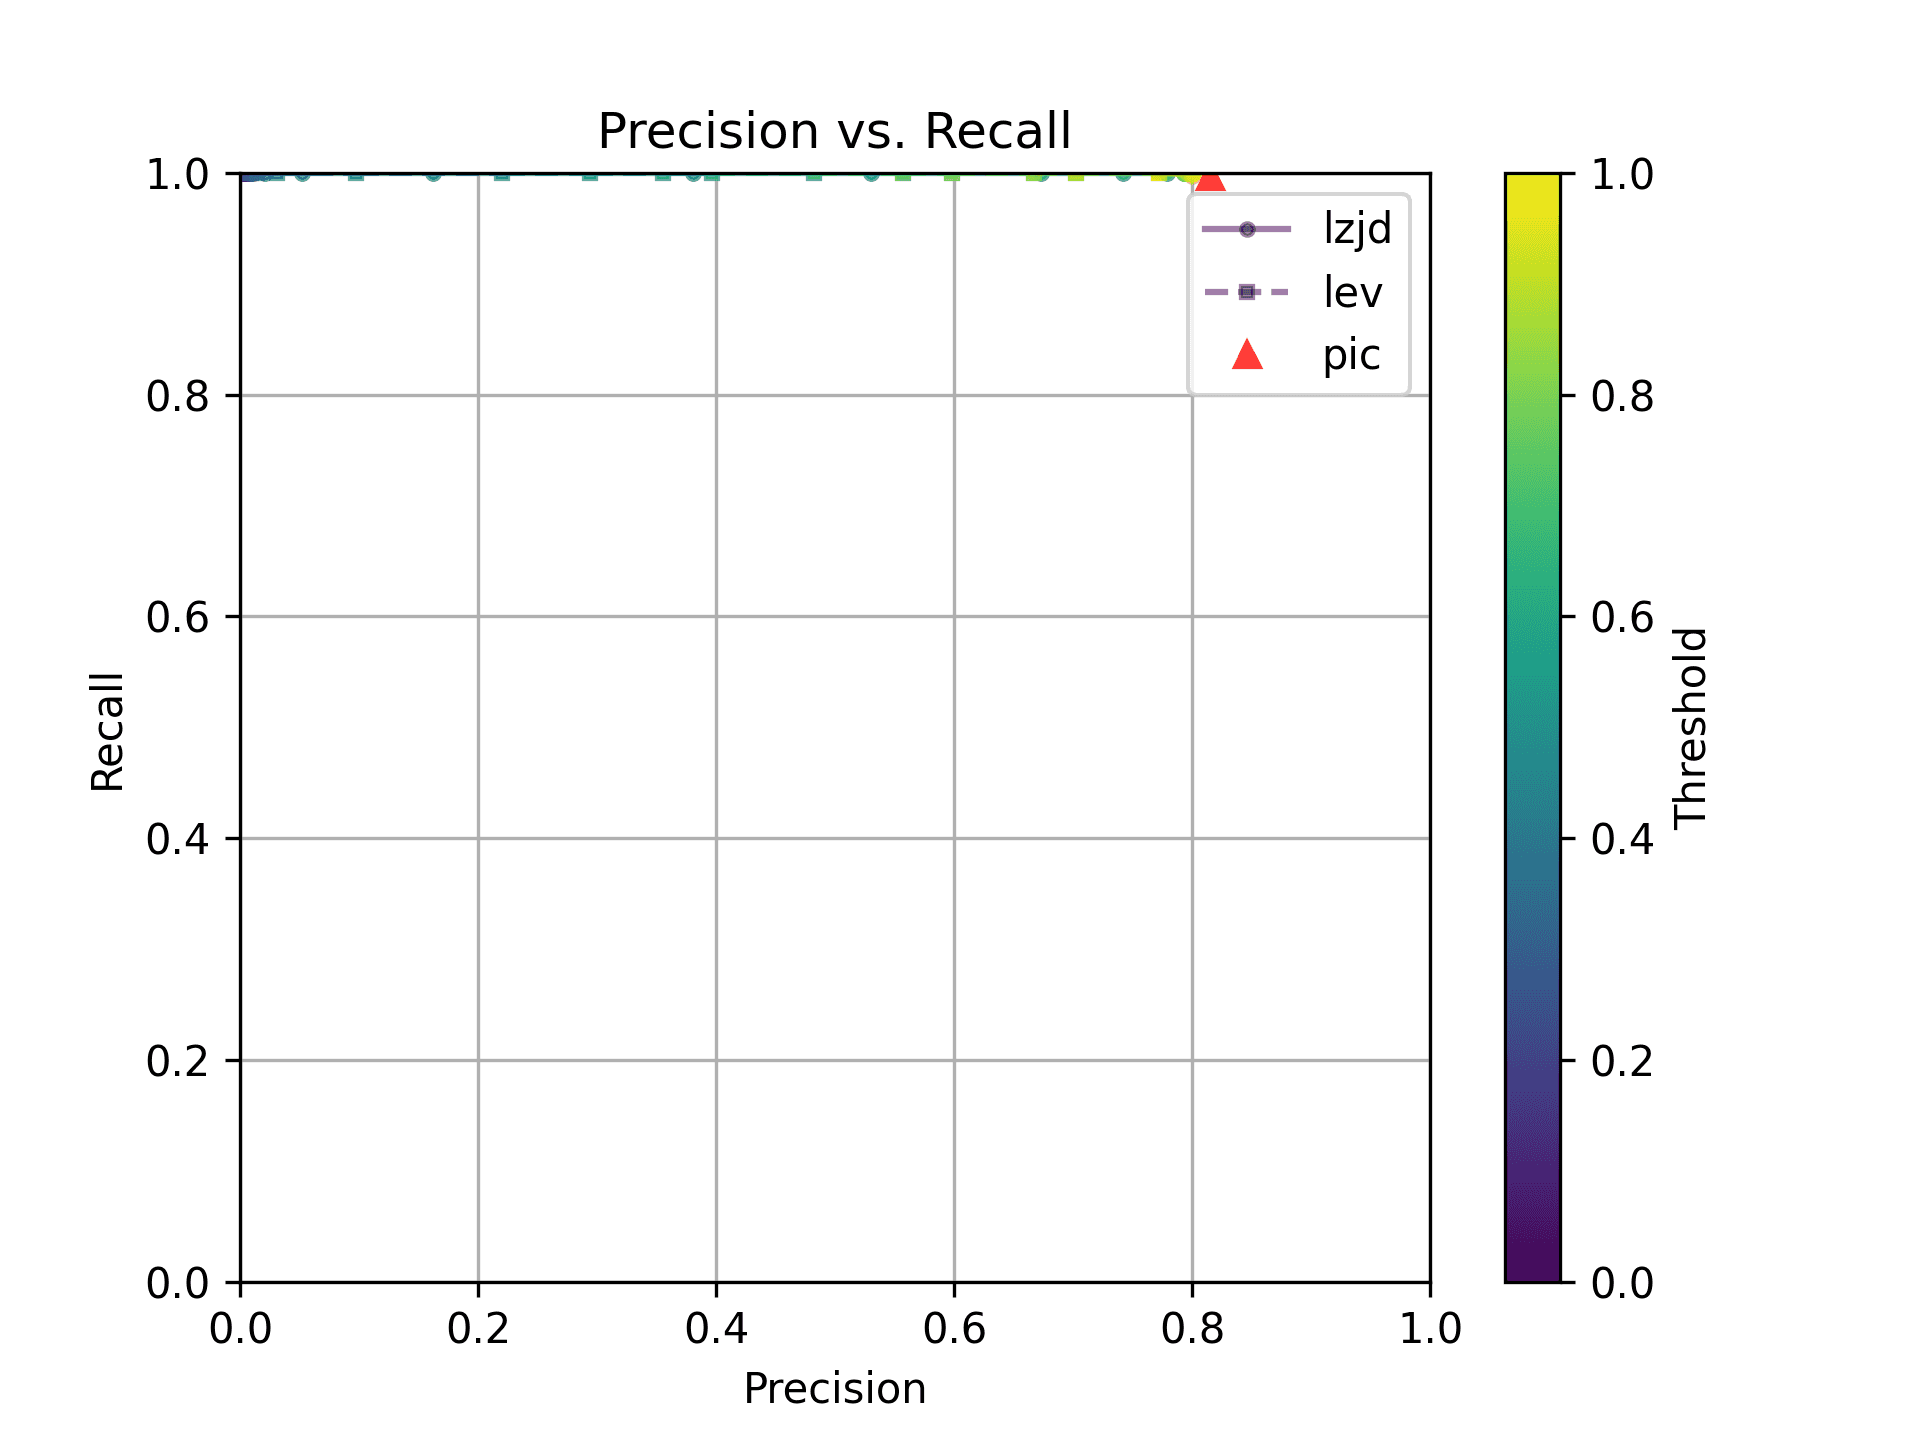
How do LZJD and LEV do? Well, that's a bit harder to quantify, because we have to pick a similarity threshold at which we consider the function to be "the same". For example, at a threshold of 0.8, we'd consider a pair of functions to be the same if they had a similarity score of 0.8 or higher. To communicate this information, we could output a confusion matrix for each possible threshold. Instead of doing this, I'll plot the results for a range of thresholds below:
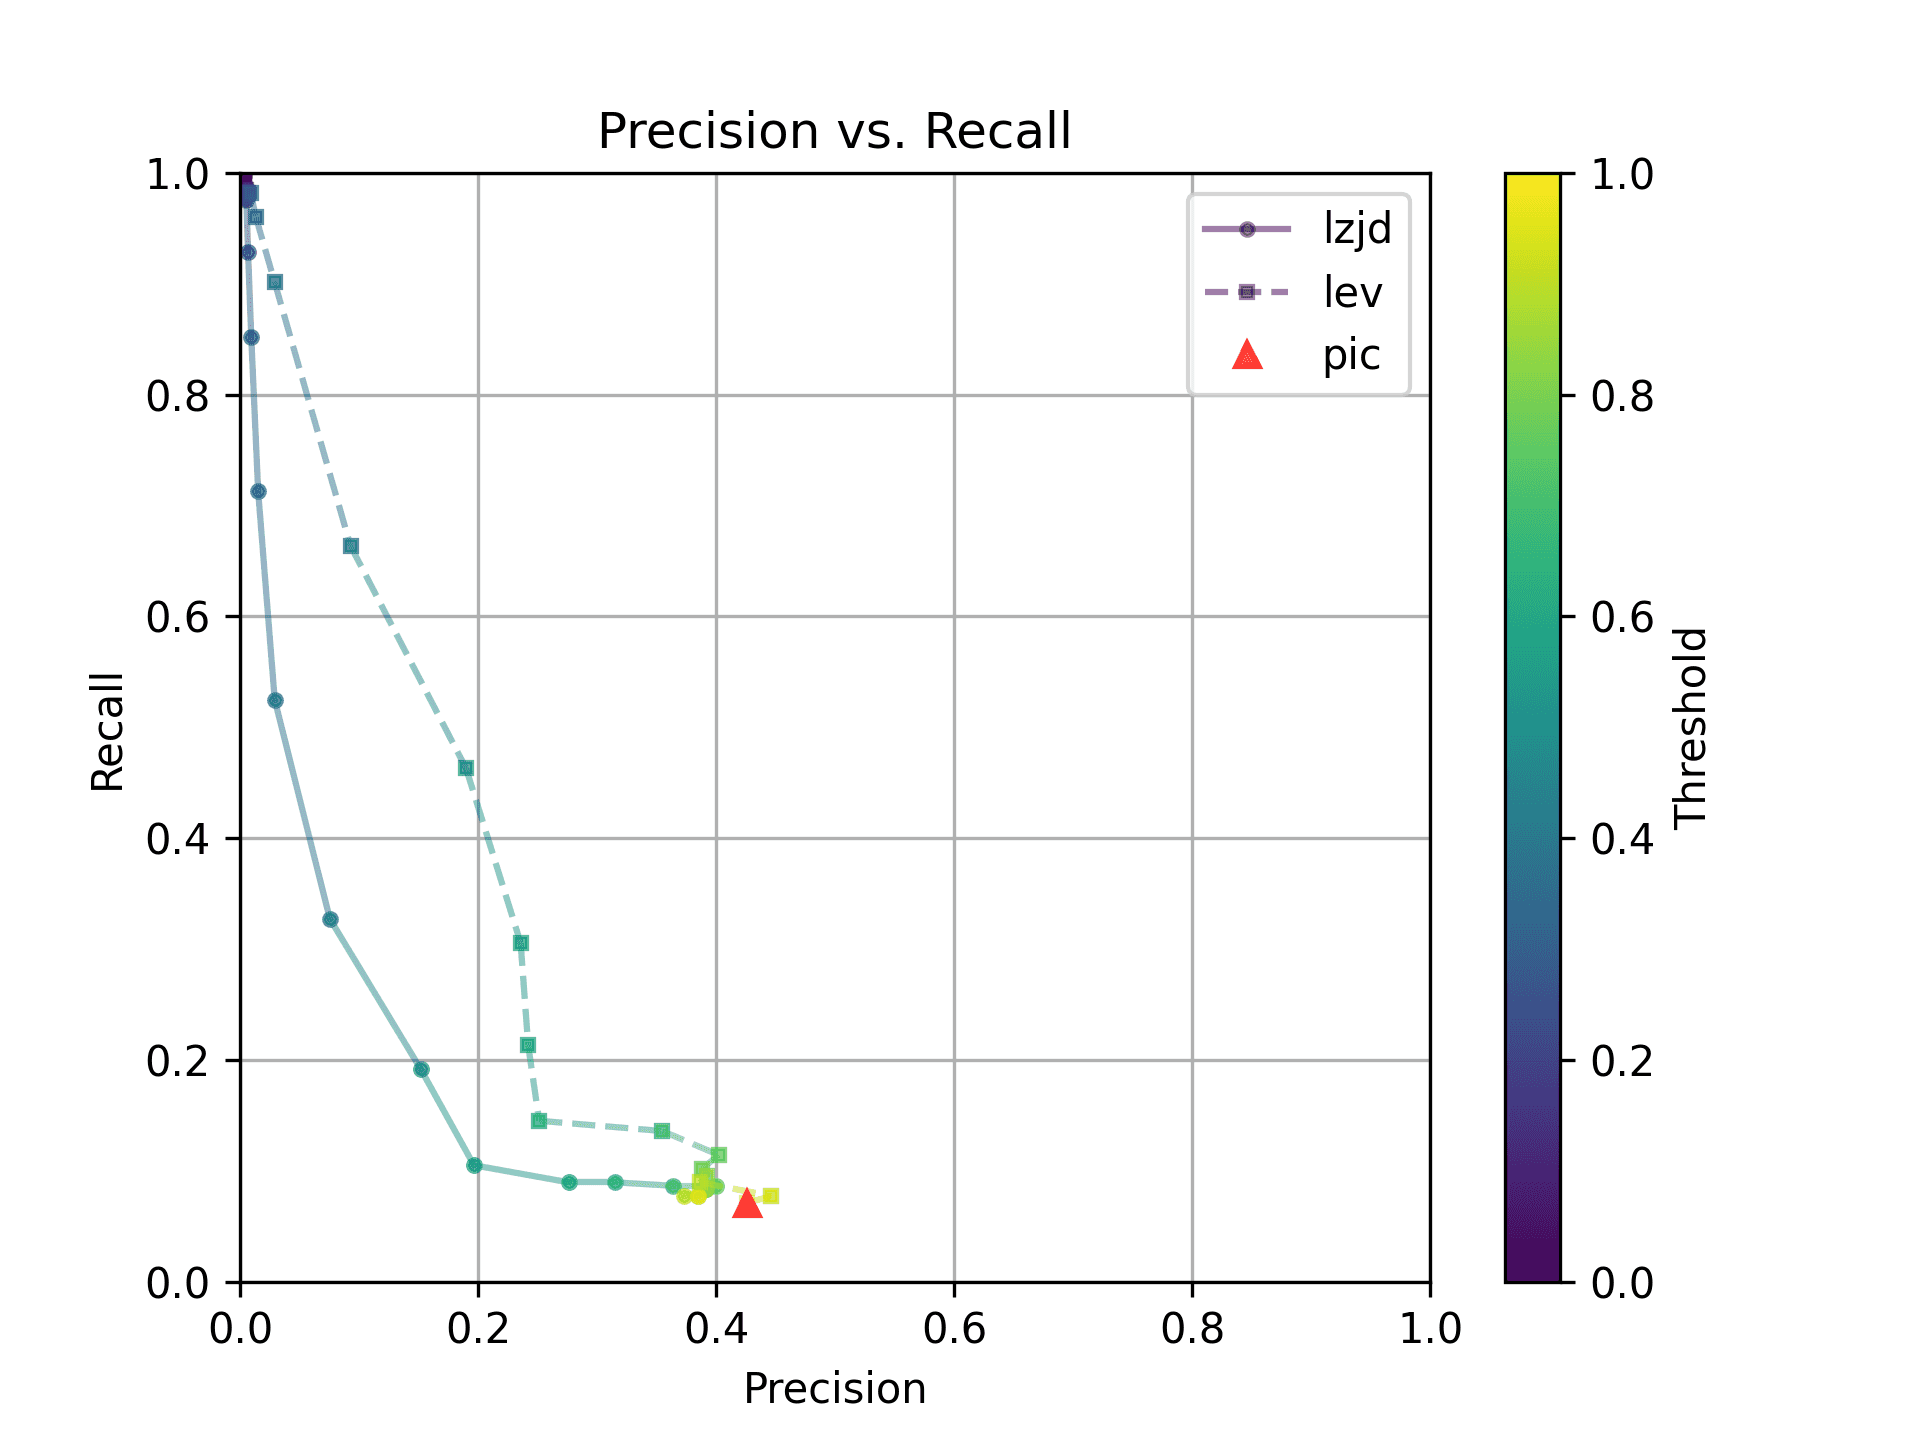
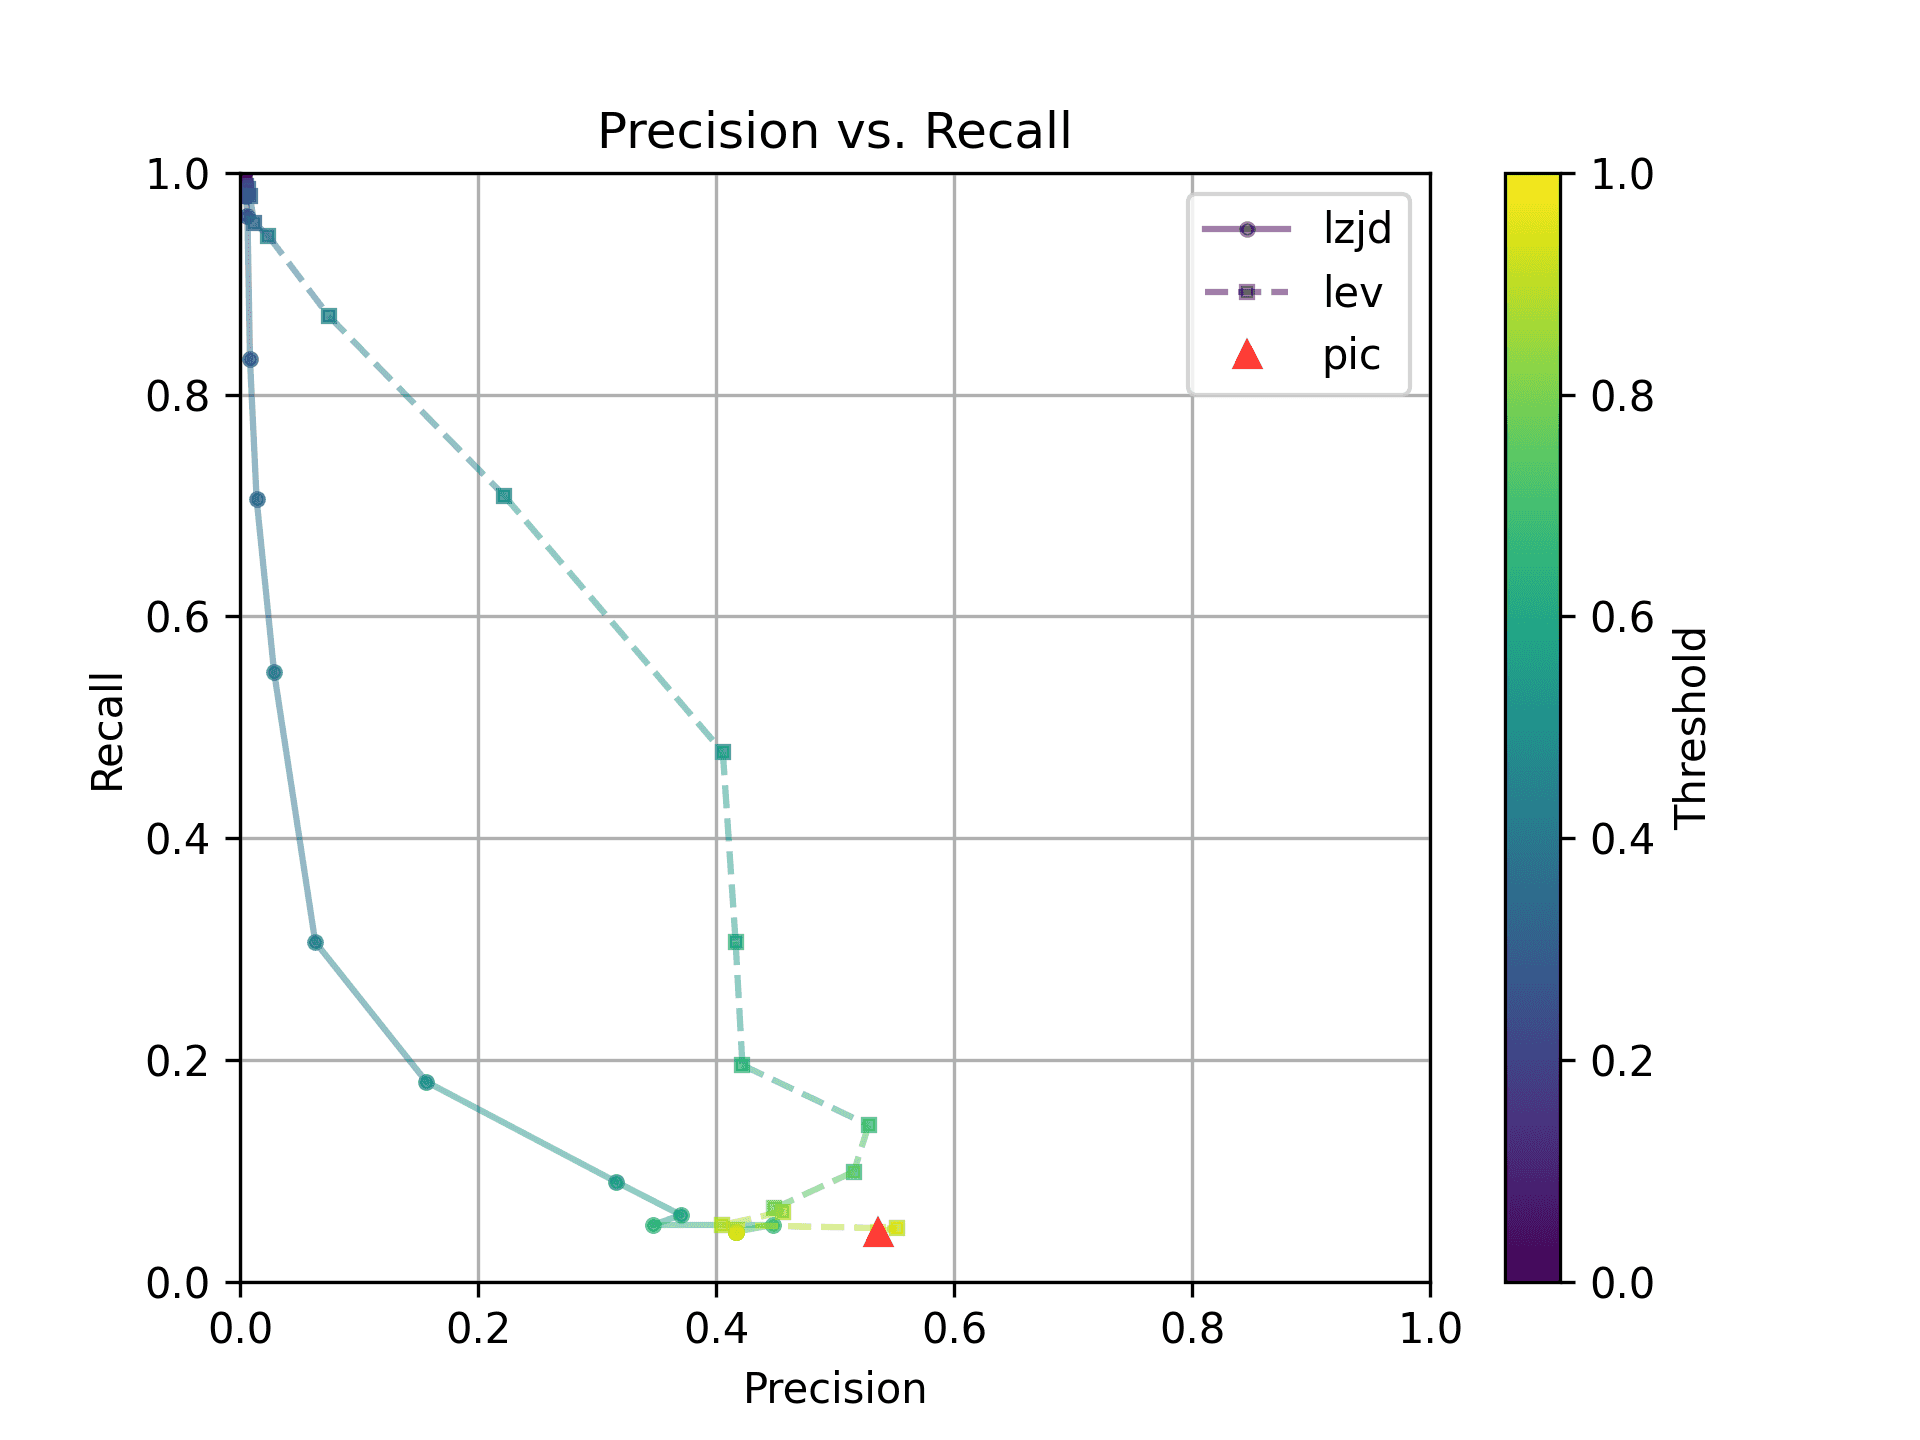
The red triangle represents the precision and recall of PIC hashing: 0.45 and 0.07 respectively, just like we got above. The solid line represents the performance of LZJD, and the dashed line represents the performance of LEV (Levenshtein distance). The color tells us what threshold is being used for LZJD and LEV. On this graph, the ideal result would be at the top right (100% recall and precision). So, for LZJD and LEV to have an advantage, it should be above or to the right of PIC hashing. But we can see that both LZJD and LEV go sharply to the left before moving up, which indicates that a substantial decrease in precision is needed to improve recall.
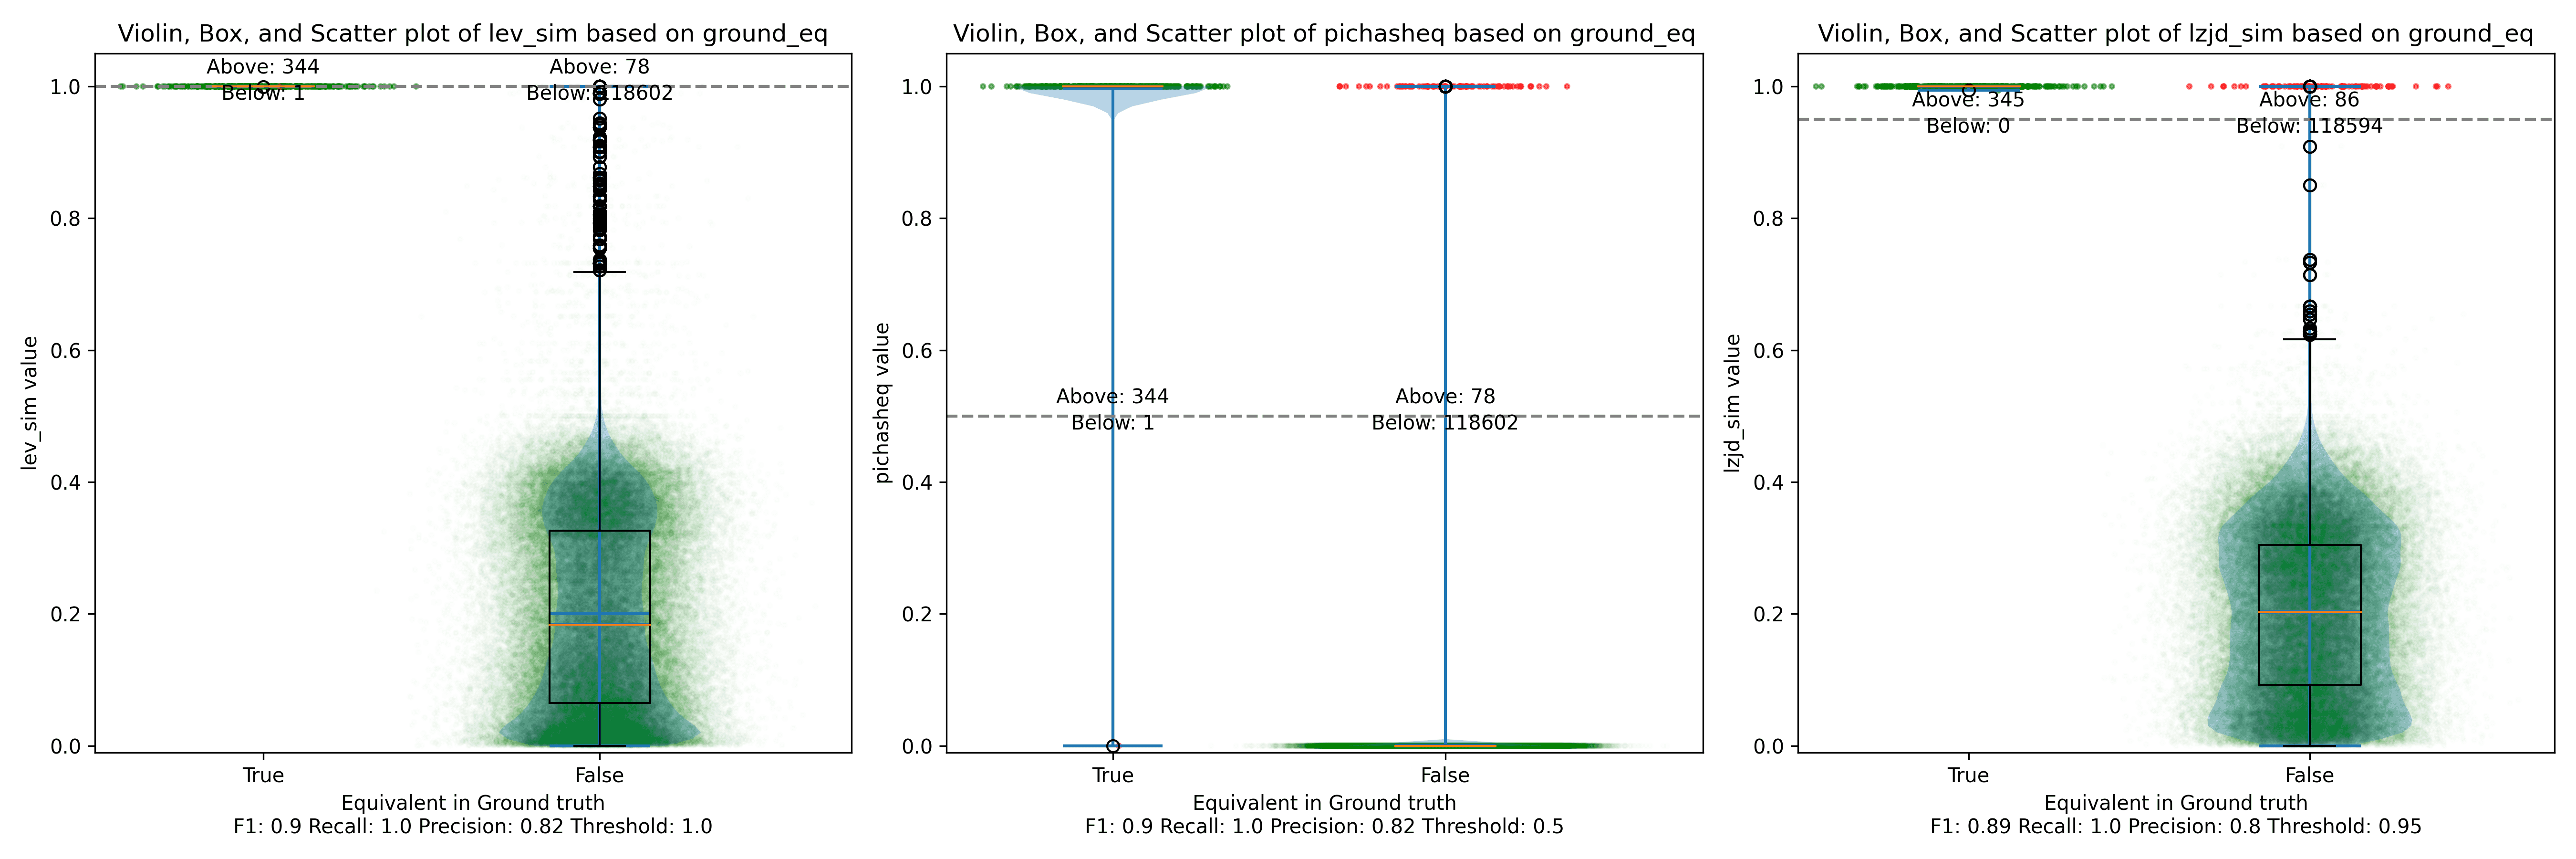
Below is what I call the violin plot. You may want to click on it to zoom in, since it's pretty wide and my blog layout is not. I also spent a long time getting that to work! There are three panels: the leftmost is for LEV, the middle is for PIC hashing, and the rightmost is for LZJD. On each panel, there is a True column, which shows the distribution of similarity scores for equivalent pairs of functions. There is also a False column, which shows the distribution scores for non-equivalent pairs of functions. Since PIC hashing does not provide a similarity score, we consider every pair to be either equivalent (1.0) or not (0.0). A horizontal dashed line is plotted to show the threshold that has the highest F1 score (i.e., a good combination of both precision and recall). Green points indicate function pairs that are correctly predicted as equivalent or not, whereas red points indicate mistakes.
I like this visualization because it shows how well each similarity metric differentiates the similarity distributions of equivalent and non-equivalent function pairs. Obviously, the hallmark of a good similarity metric is that the distribution of equivalent functions should be higher than non-equivalent functions! Ideally, the similarity metric should produce distributions that do not overlap at all, so we could draw a line between them. In practice, the distributions usually intersect, and so instead we're forced to make a trade-off between precision and recall, as can be seen in the above Precision vs. Recall graph.
Overall, we can see from the violin plot that LEV and LZJD have a slightly
higher F1 score (reported at the bottom of the violin plot), but none of these
techniques are doing a great job. This implies that gcc and clang produce
code that is quite different syntactically.
Experiment 1b: openssl 1.1.1w Compiled With Different Optimization Levels
The next comparison I did was to compile openssl 1.1.1w with gcc -g and
optimization levels -O0, -O1, -O2, -O3.
-O0 and -O3
Let's start with one of the extremes, comparing -O0 and -O3:
The first thing you might be wondering about in this graph is Where is PIC hashing? Well, it's there at (0, 0) if you look closely. The violin plot gives us a little more information about what is going on.
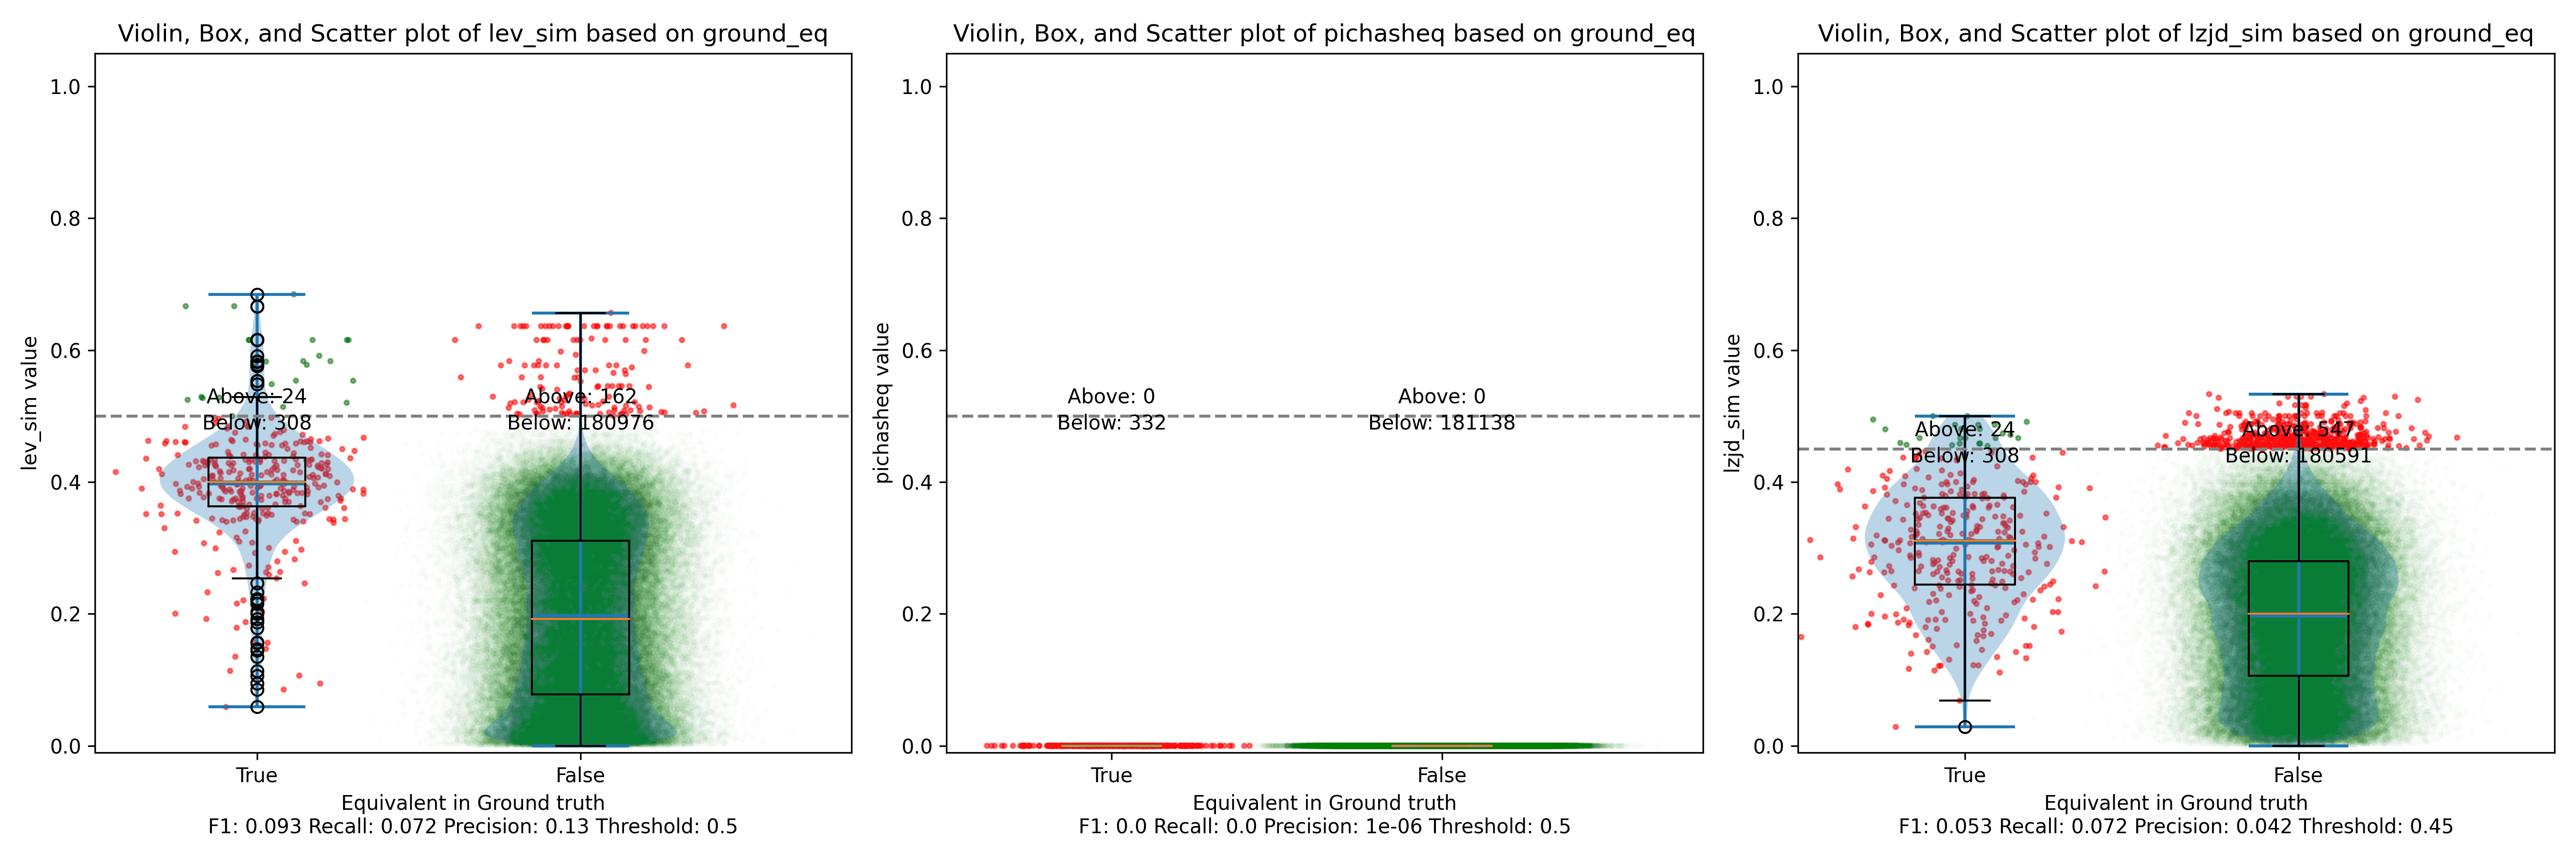
Here we can see that PIC hashing made no positive predictions. In other
words, none of the PIC hashes from the -O0 binary matched any of the PIC
hashes from the -O3 binary. I included this problem because I thought it
would be very challenging for PIC hashing, and I was right! But after some
discussion with Cory, we realized something fishy was going on. To achieve a
precision of 0.0, PIC hashing can't find any functions equivalent. That
includes trivially simple functions. If your function is just a ret
there's not much optimization to do.
Eventually, I guessed that the -O0 binary did not use the
-fomit-frame-pointer option, whereas all other optimization levels do. This
matters because this option changes the prologue and epilogue of every
function, which is why PIC hashing does so poorly here.
LEV and LZJD do slightly better again, achieving low (but non-zero) F1 scores. But to be fair, none of the techniques do very well here. It's a difficult problem.
-O2 and -O3
On the much easier extreme, let's look at -O2 and -O3.

Nice! PIC hashing does pretty well here, achieving a recall of 0.79 and a precision of 0.78. LEV and LZJD do about the same. However, the Precision vs. Recall graph for LEV shows a much more appealing trade-off line. LZJD's trade-off line is not nearly as appealing, as it's more horizontal.
You can start to see more of a difference between the distributions in the violin plots here in the LEV and LZJD panels.
I'll call this one a tie.
-O1 and -O2
I would also expect -O1 and -O2 to be fairly similar, but not as similar as
-O2 and -O3. Let's see:

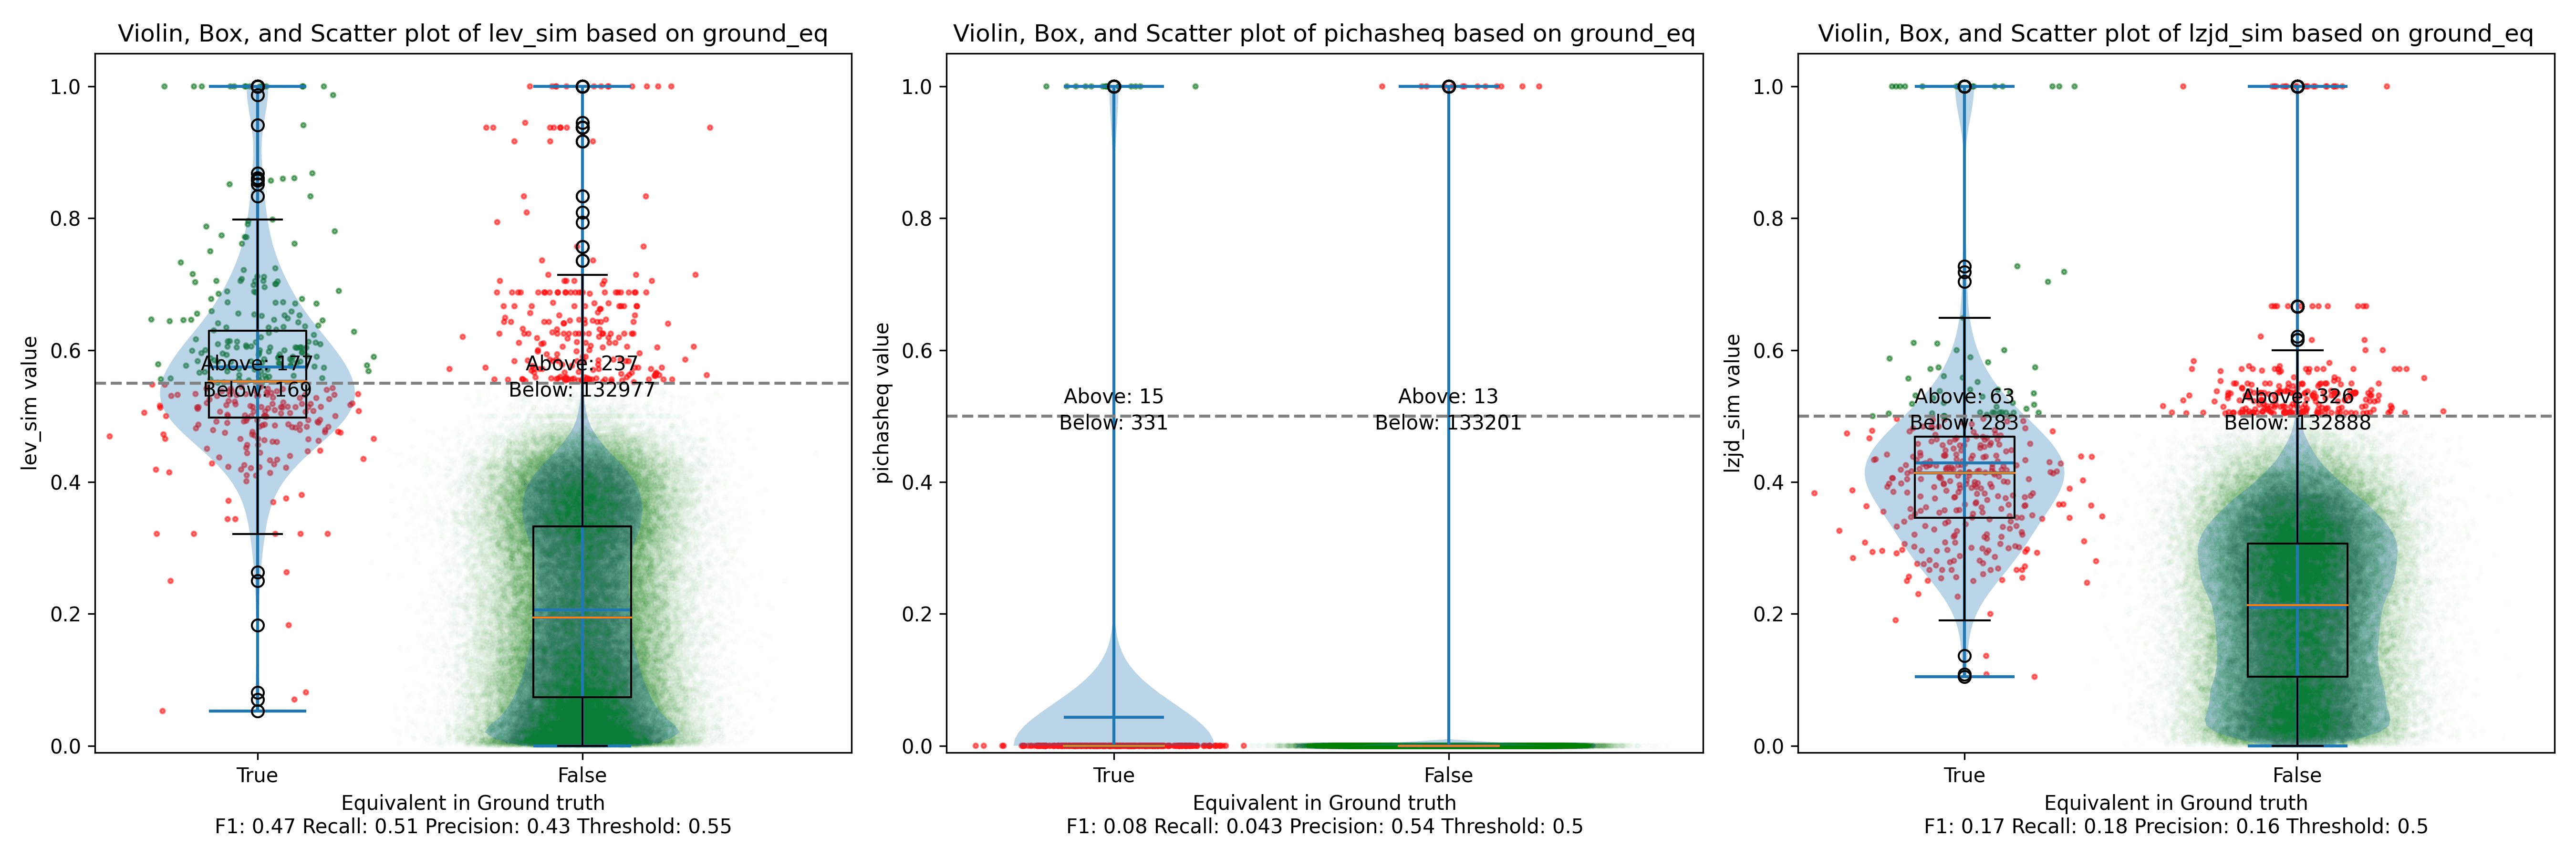
The Precision vs. Recall graph is very interesting. PIC hashing starts at a precision of 0.54 and a recall of 0.043. LEV in particular shoots straight up, indicating that by lowering the threshold, it is possible to increase recall substantially without losing much precision. A particularly attractive trade-off might be a precision of 0.43 and a recall of 0.51. This is the type of trade-off I was hoping for in fuzzy hashing.
Unfortunately, LZJD's trade-off line is again not nearly as appealing, as it curves in the wrong direction.
We'll say this is a pretty clear win for LEV.
-O1 and -O3
Finally, let's compare -O1 and -O3, which are different, but both have the
-fomit-frame-pointer option enabled by default.
These graphs look almost identical to comparing -O1 and -O2; I guess the
difference between -O2 and -O3 is really pretty minor. So it's again a win for LEV.
Experiment 2: Different openssl Versions
The final experiment I did was to compare various versions of openssl. This experiment was suggested by Cory, who thought it was reflective of typical malware RE scenarios. The idea is that the malware author released Malware 1.0, which you RE. Later, the malware changes a few things and releases Malware 1.1, and you want to detect which functions did not change so that you can avoid REing them again.
We looked at a few different versions of openssl:
| Version | Release Date | Months In Between |
|---|---|---|
| 1.0.2u | Dec 20, 2019 | N/A |
| 1.1.1 | Sep 11, 2018 | N/A |
| 1.1.1q | Oct 12, 2022 | 49 |
| 1.1.1v | Aug 1, 2023 | 9 |
| 1.1.1w | Sep 11, 2023 | 1 |
For each version, I compiled them using gcc -g -O2.
openssl 1.0 and 1.1 are different minor versions of openssl. As explained here,
Letter releases, such as 1.0.2a, exclusively contain bug and security fixes and no new features.
So, we would expect that openssl 1.0.2u is fairly different than any 1.1.1 version. And we would expect that in the same minor version, 1.1.1 would be similar to 1.1.1q, but would be more different than 1.1.1w.
Experiment 2a: openssl 1.0.2u vs 1.1.1w
As before, let's start with the most extreme comparison: 1.0.2u vs 1.1.1w.
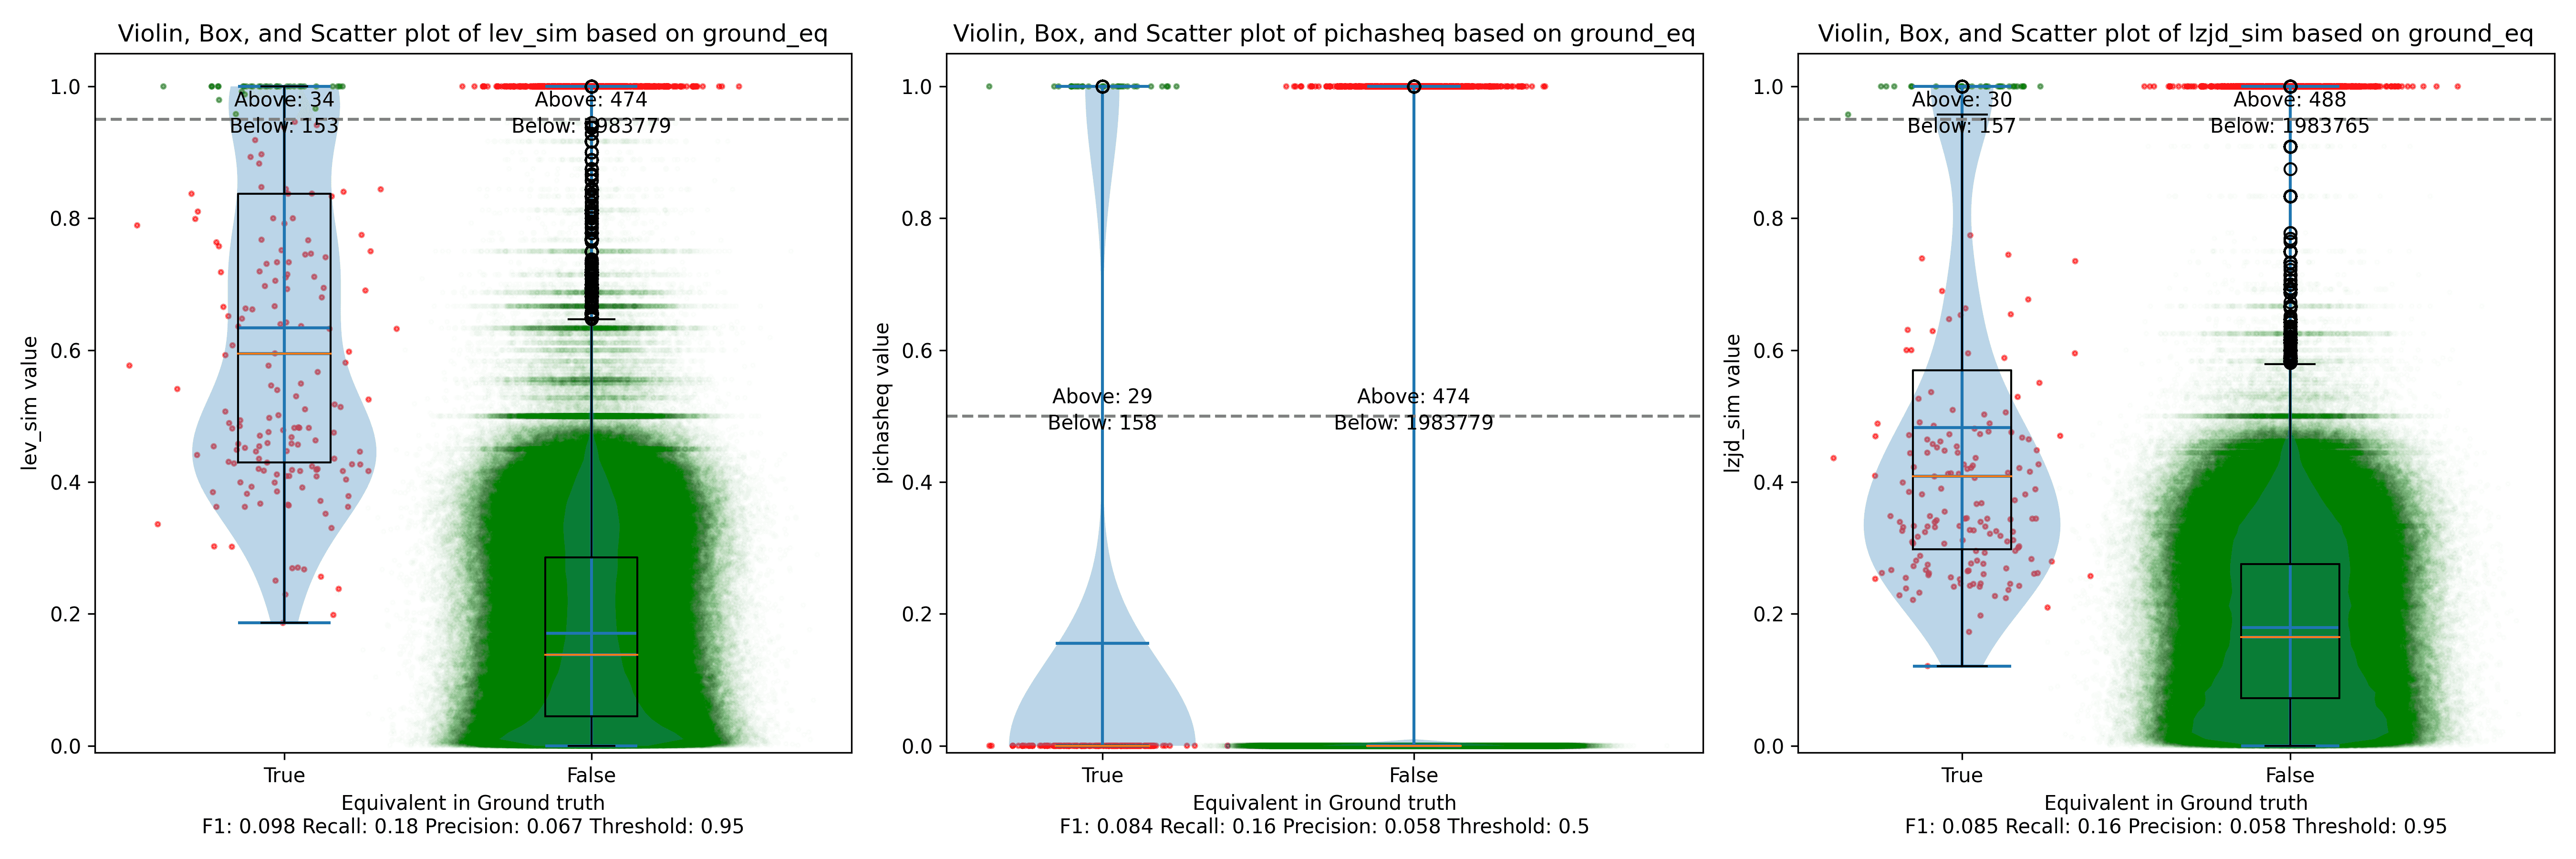
Perhaps not too surprisingly, because the two binaries are quite different, all three techniques struggle. We'll say this is a three way tie.
Experiment 2b: openssl 1.1.1 vs 1.1.1w
Now let's look at the original 1.1.1 release from September 2018, and compare to the 1.1.1w bugfix release from September 2023. Although a lot of time has passed between the releases, the only differences should be bug and security fixes.

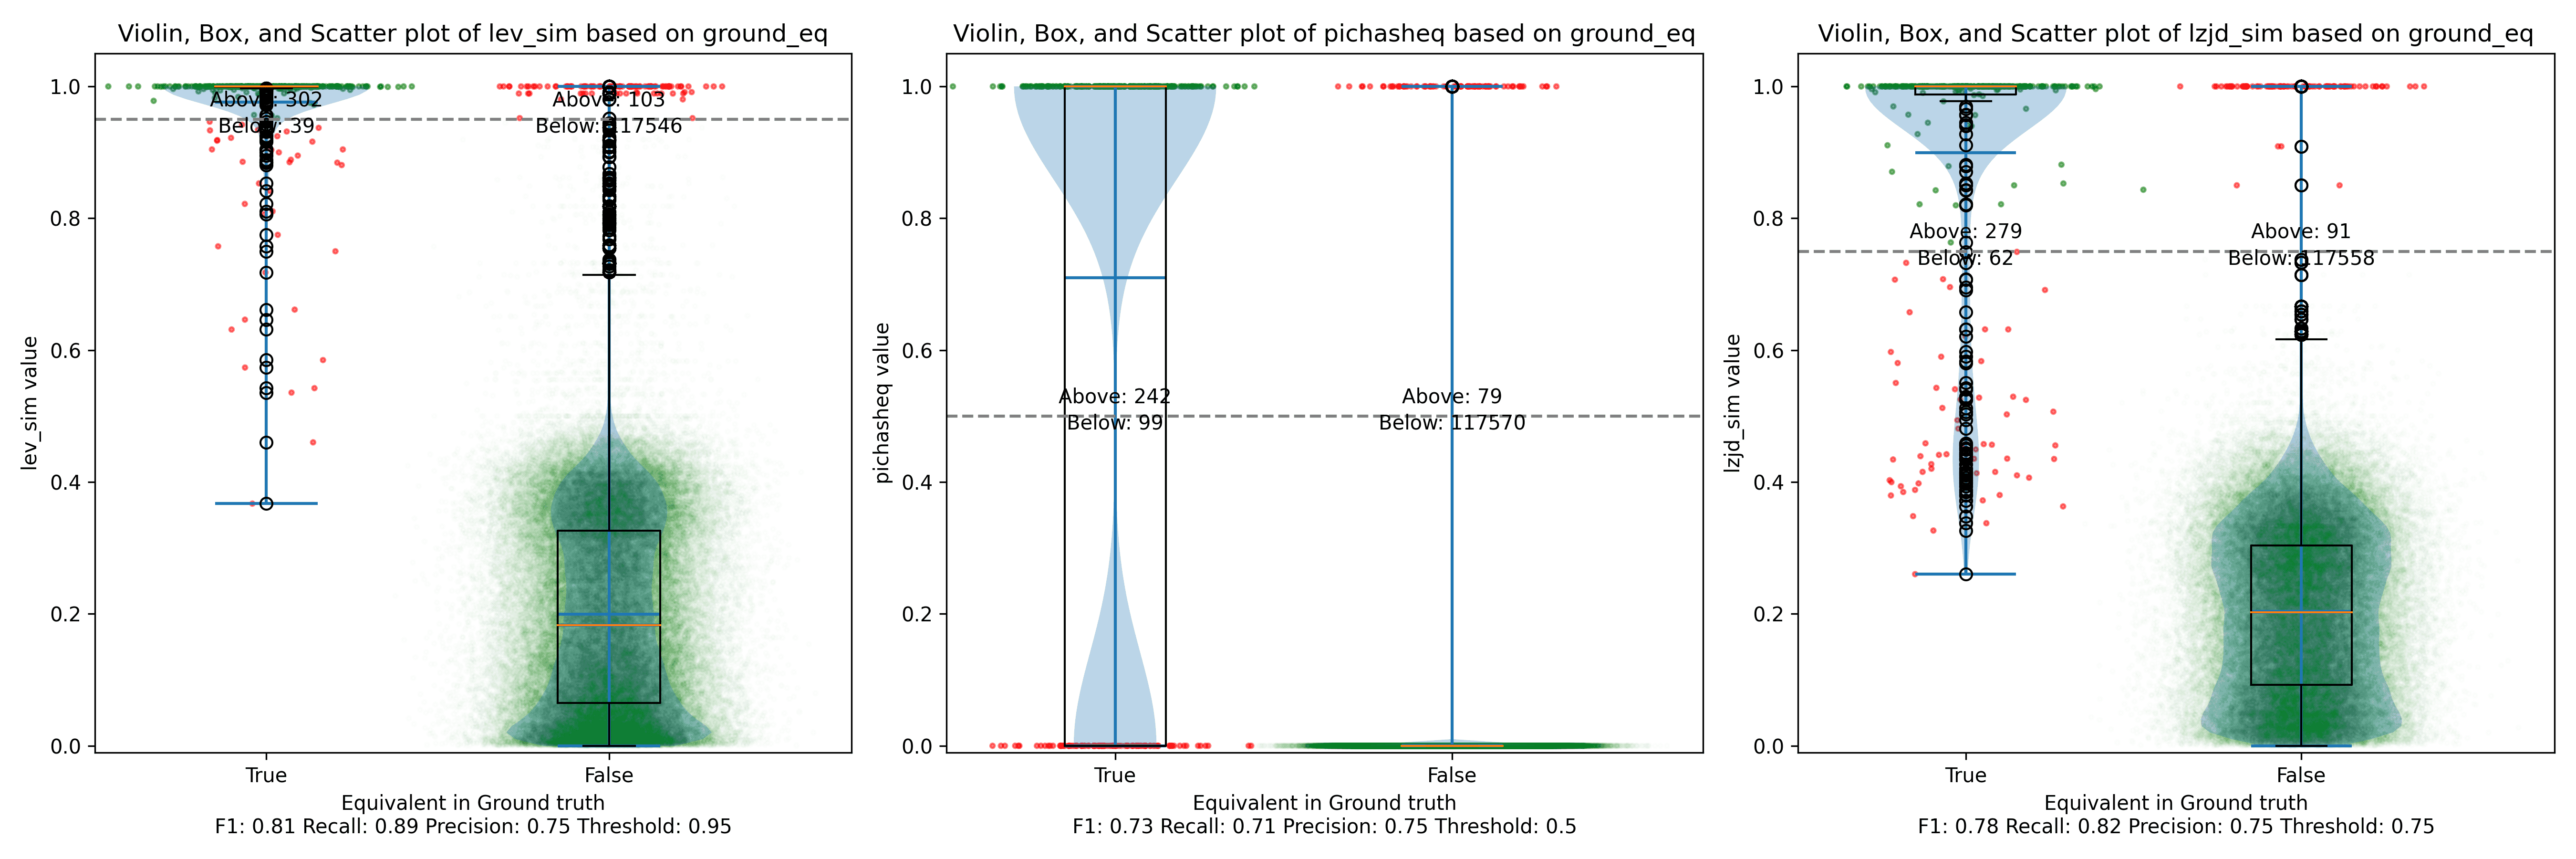
All three techniques do much better on this experiment, presumably because there are far fewer changes. PIC hashing achieves a precision of 0.75 and a recall of 0.71. LEV and LZJD go almost straight up, indicating an improvement in recall with minimal trade-off in precision. At roughly the same precision (0.75), LZJD achieves a recall of 0.82, and LEV improves it to 0.89.
LEV is the clear winner, with LZJD also showing a clear advantage over PIC.
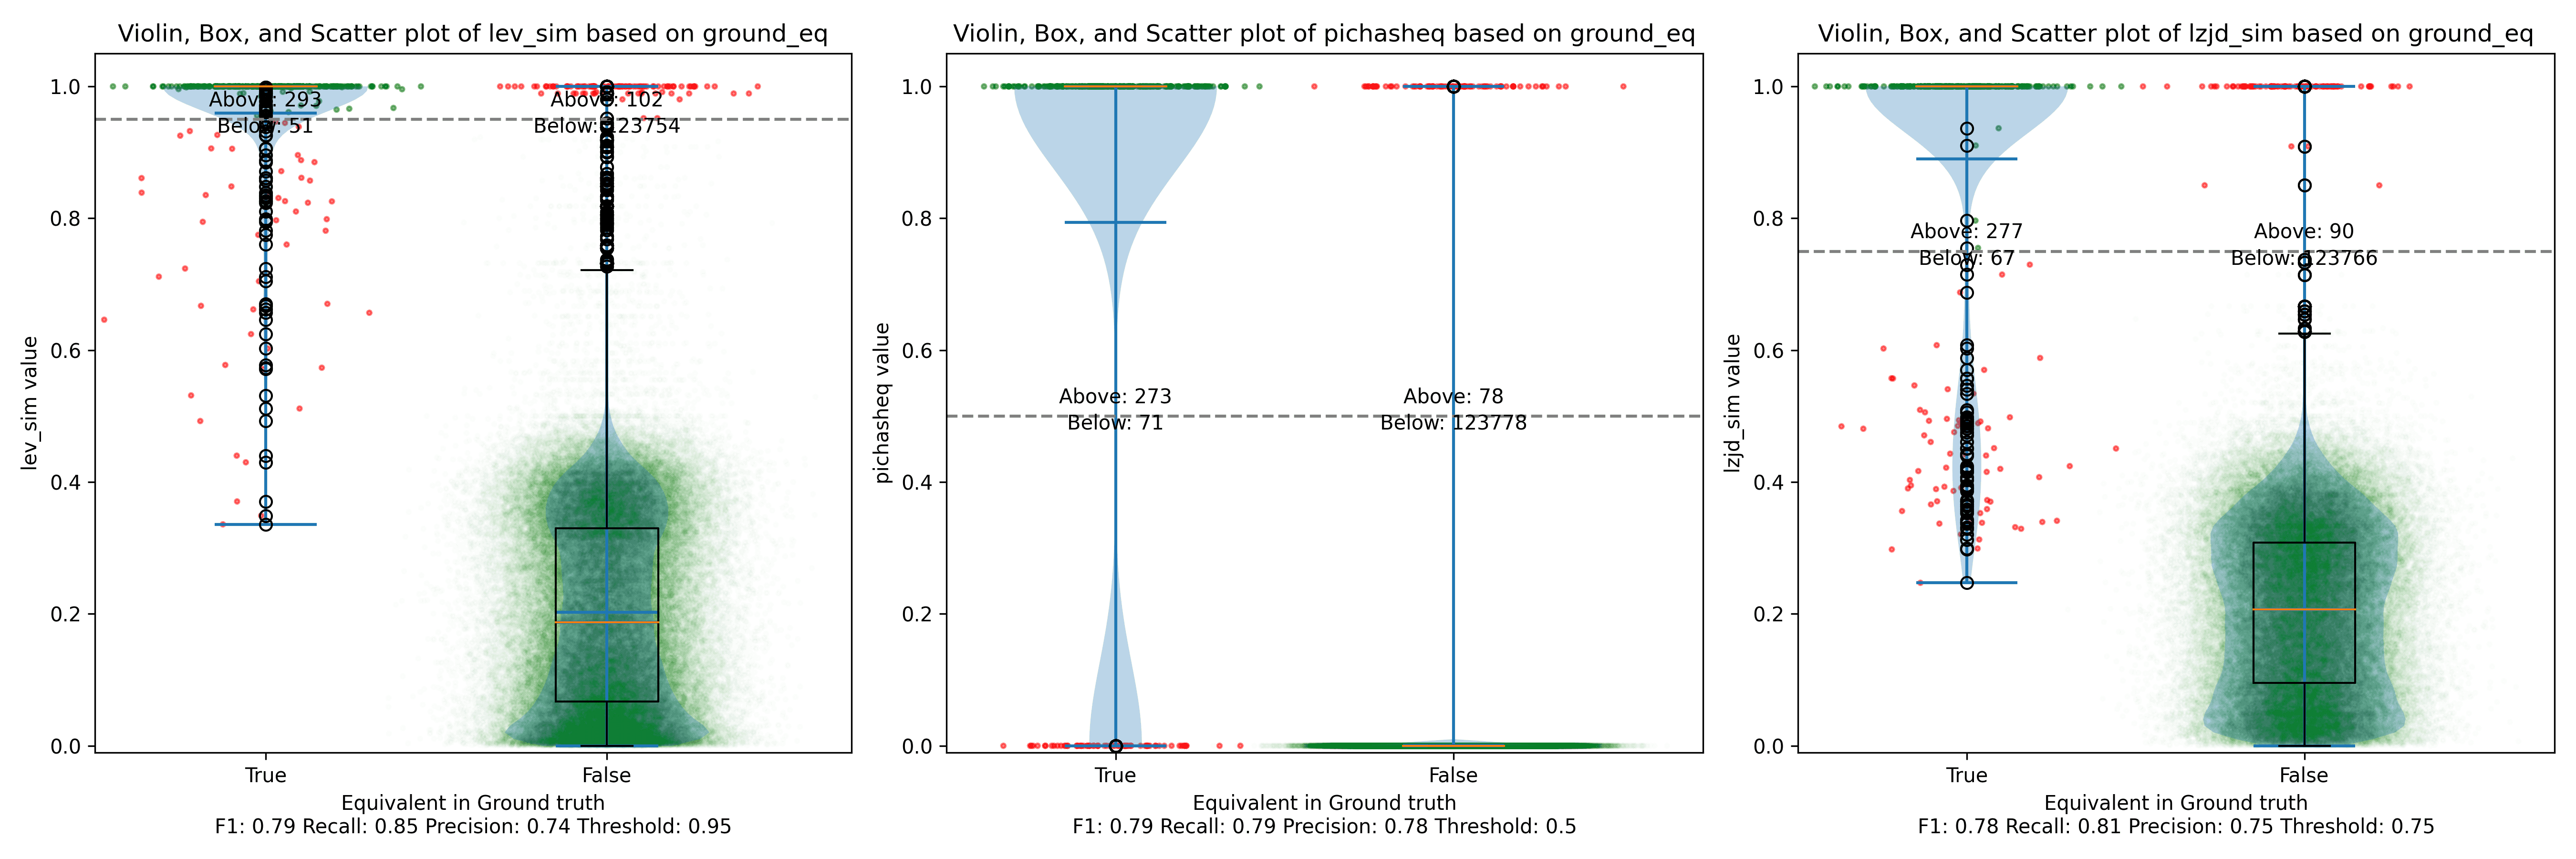
Experiment 2c: openssl 1.1.1q vs 1.1.1w
Let's continue looking at more similar releases. Now we'll compare 1.1.1q from July 2022 to 1.1.1w from September 2023.
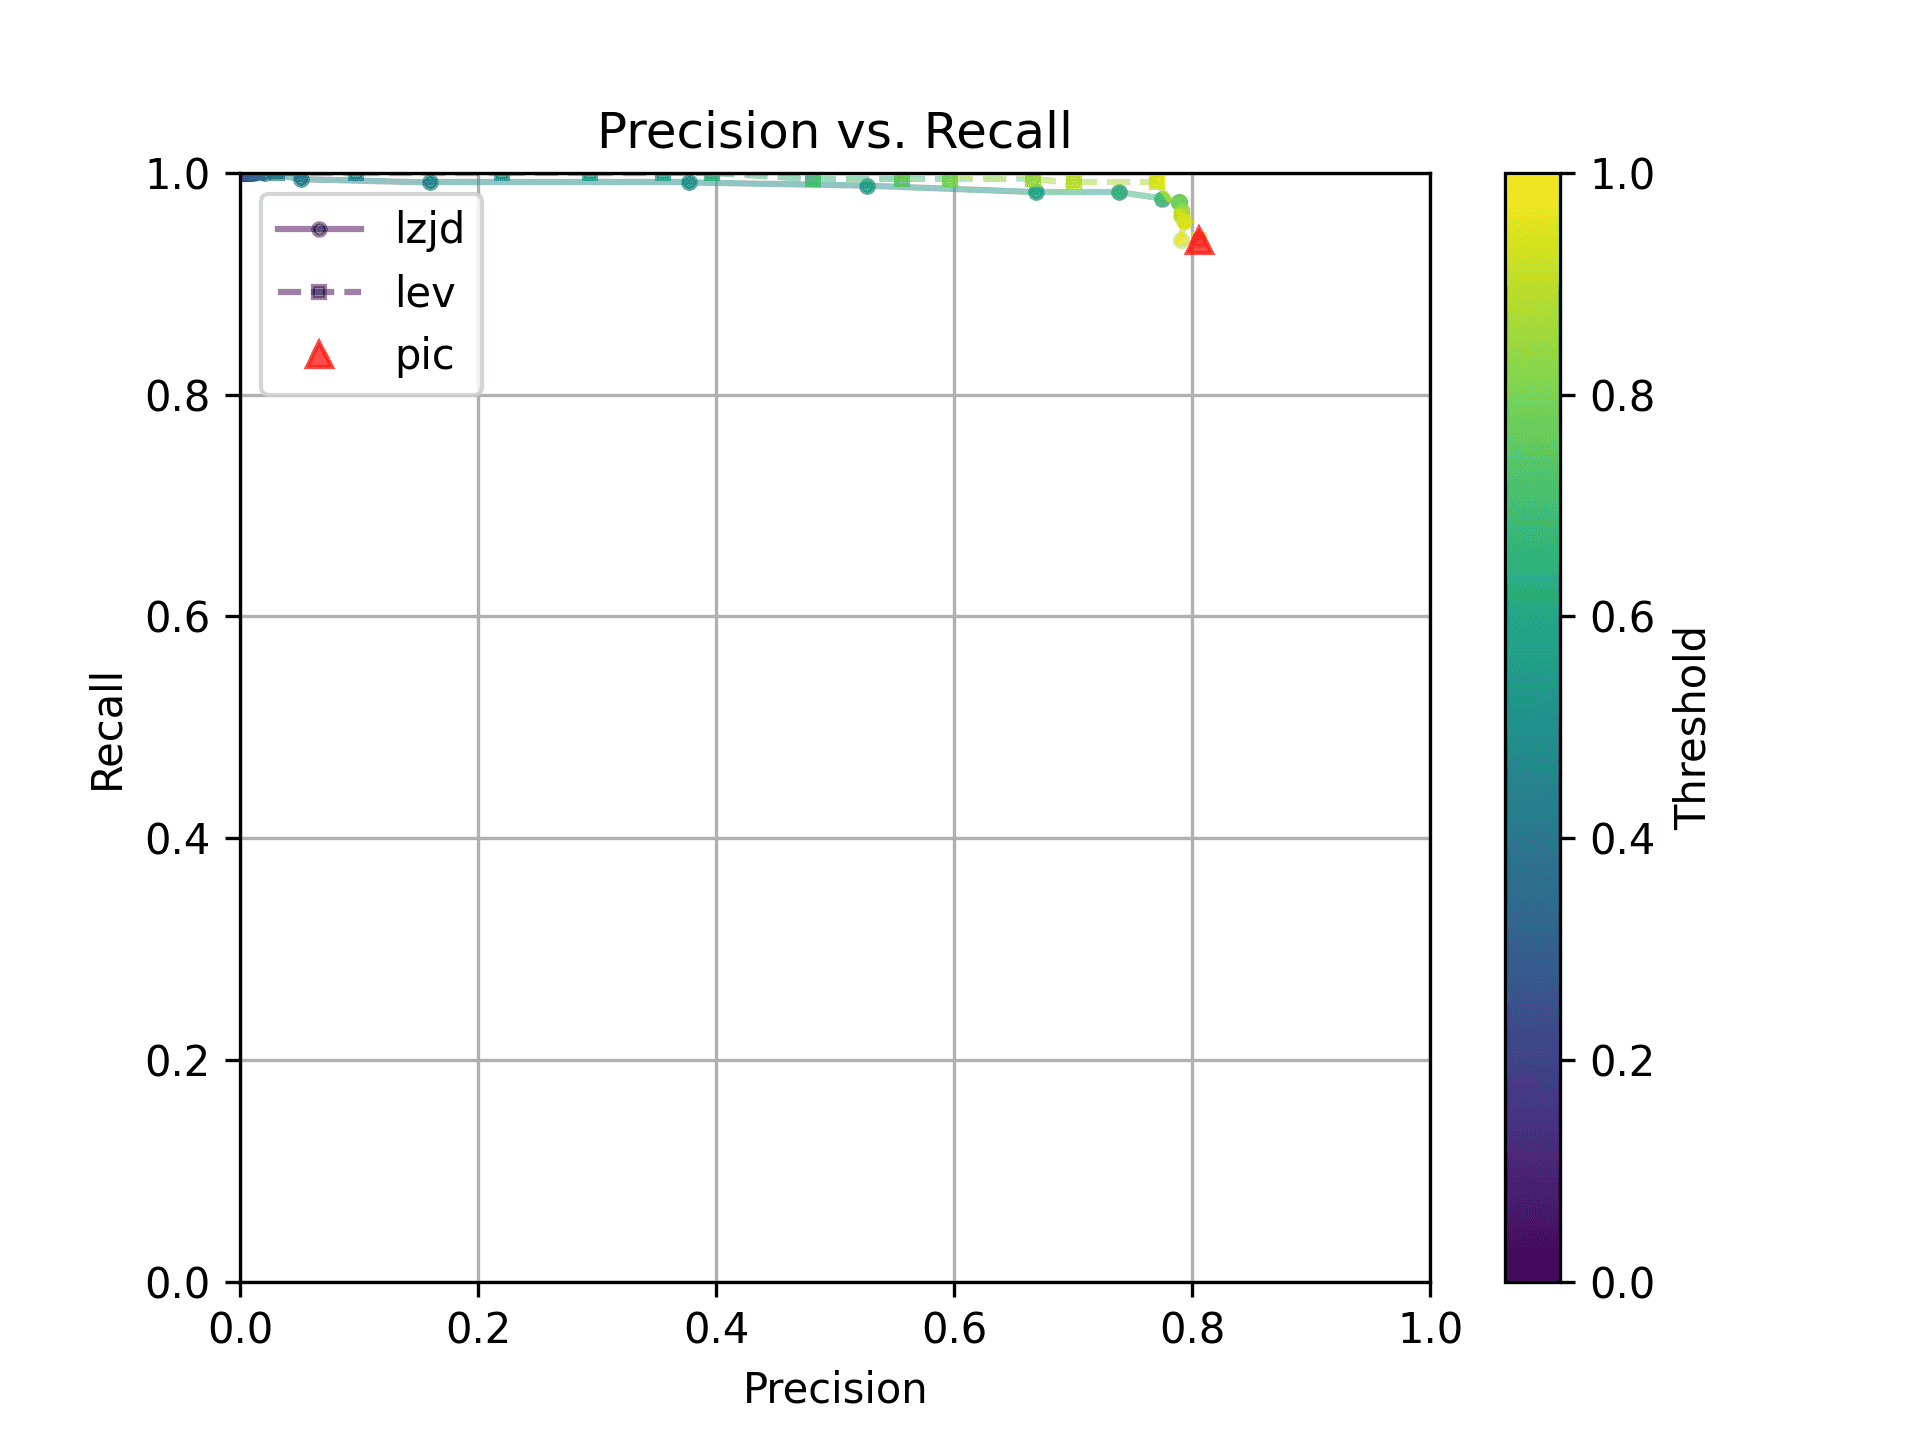
As can be seen in the Precision vs. Recall graph, PIC hashing starts at an impressive precision of 0.81 and a recall of 0.94. There simply isn't a lot of room for LZJD or LEV to make an improvement.
This is a three way tie.
Experiment 2d: openssl 1.1.1v vs 1.1.1w
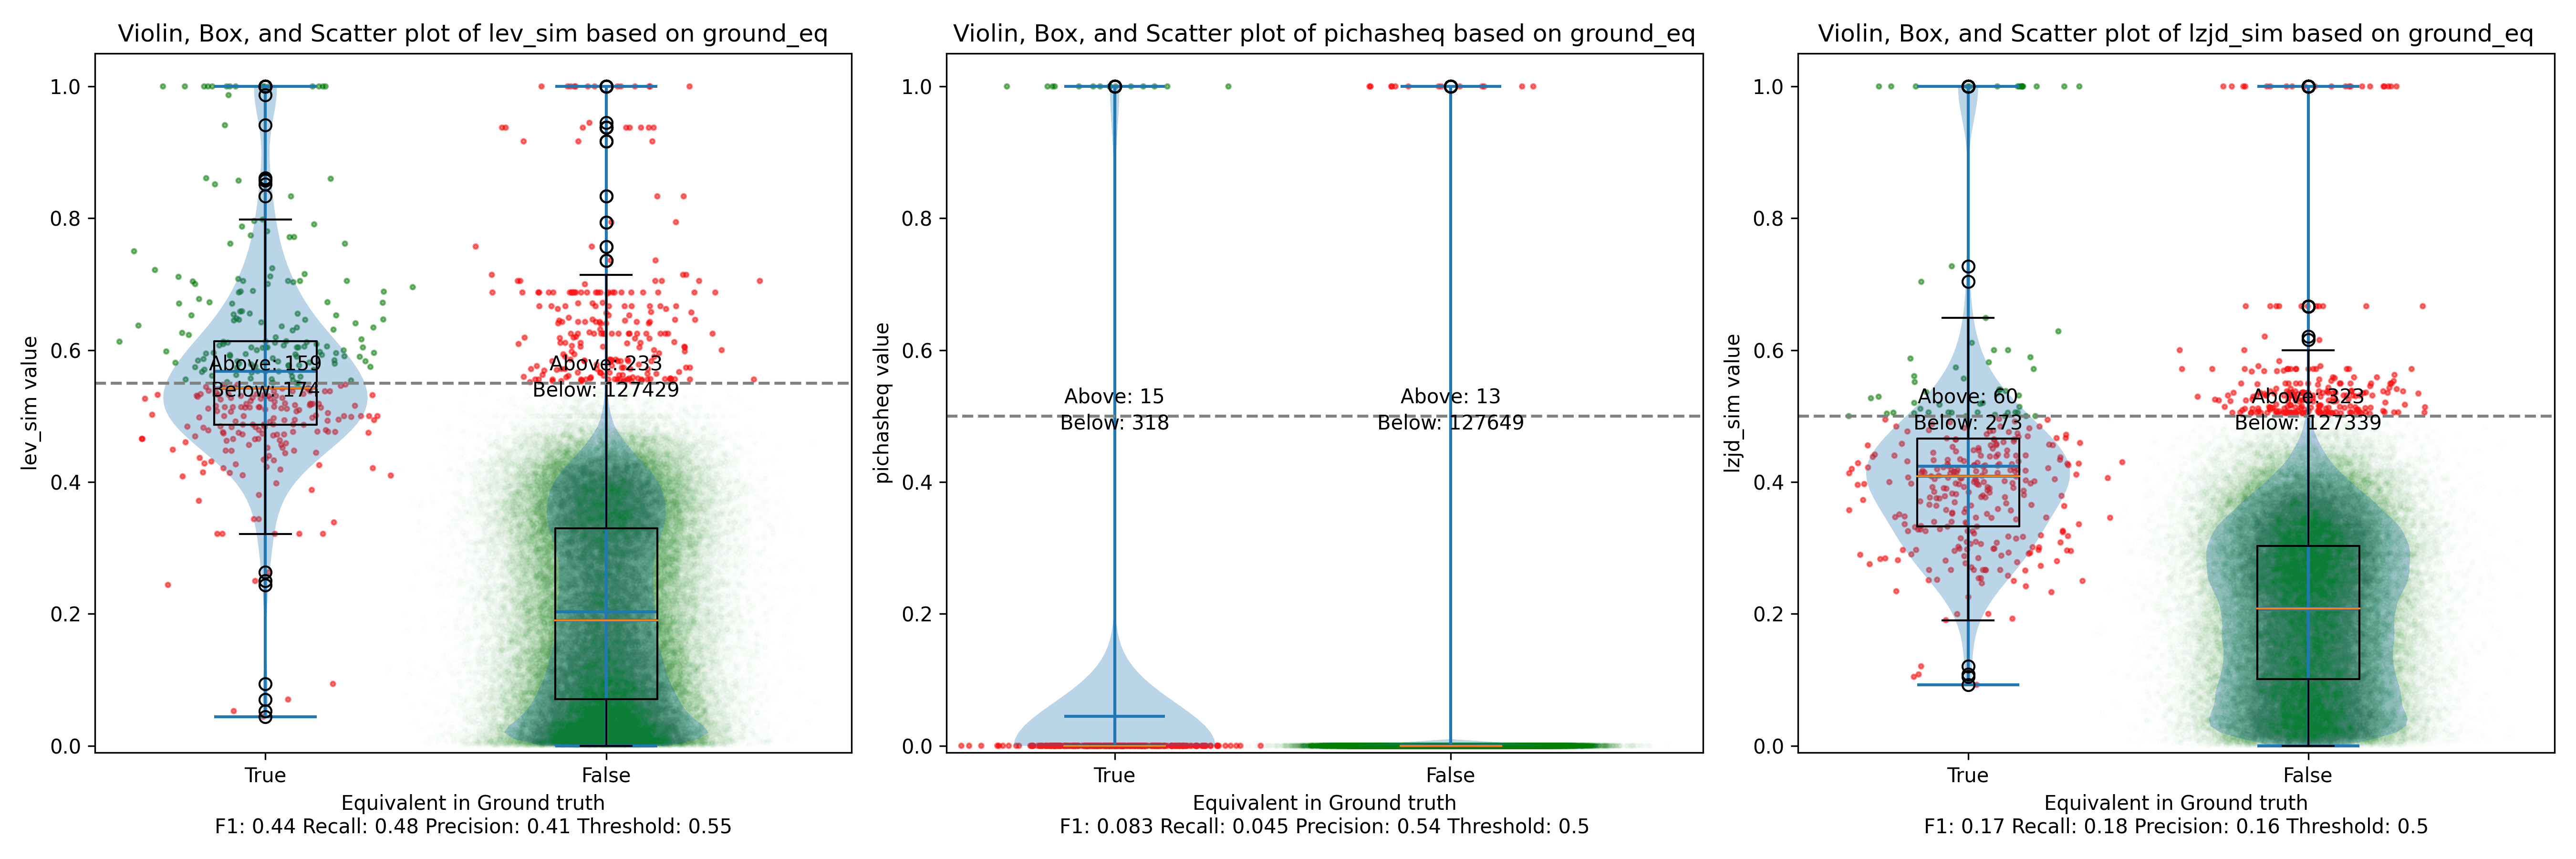
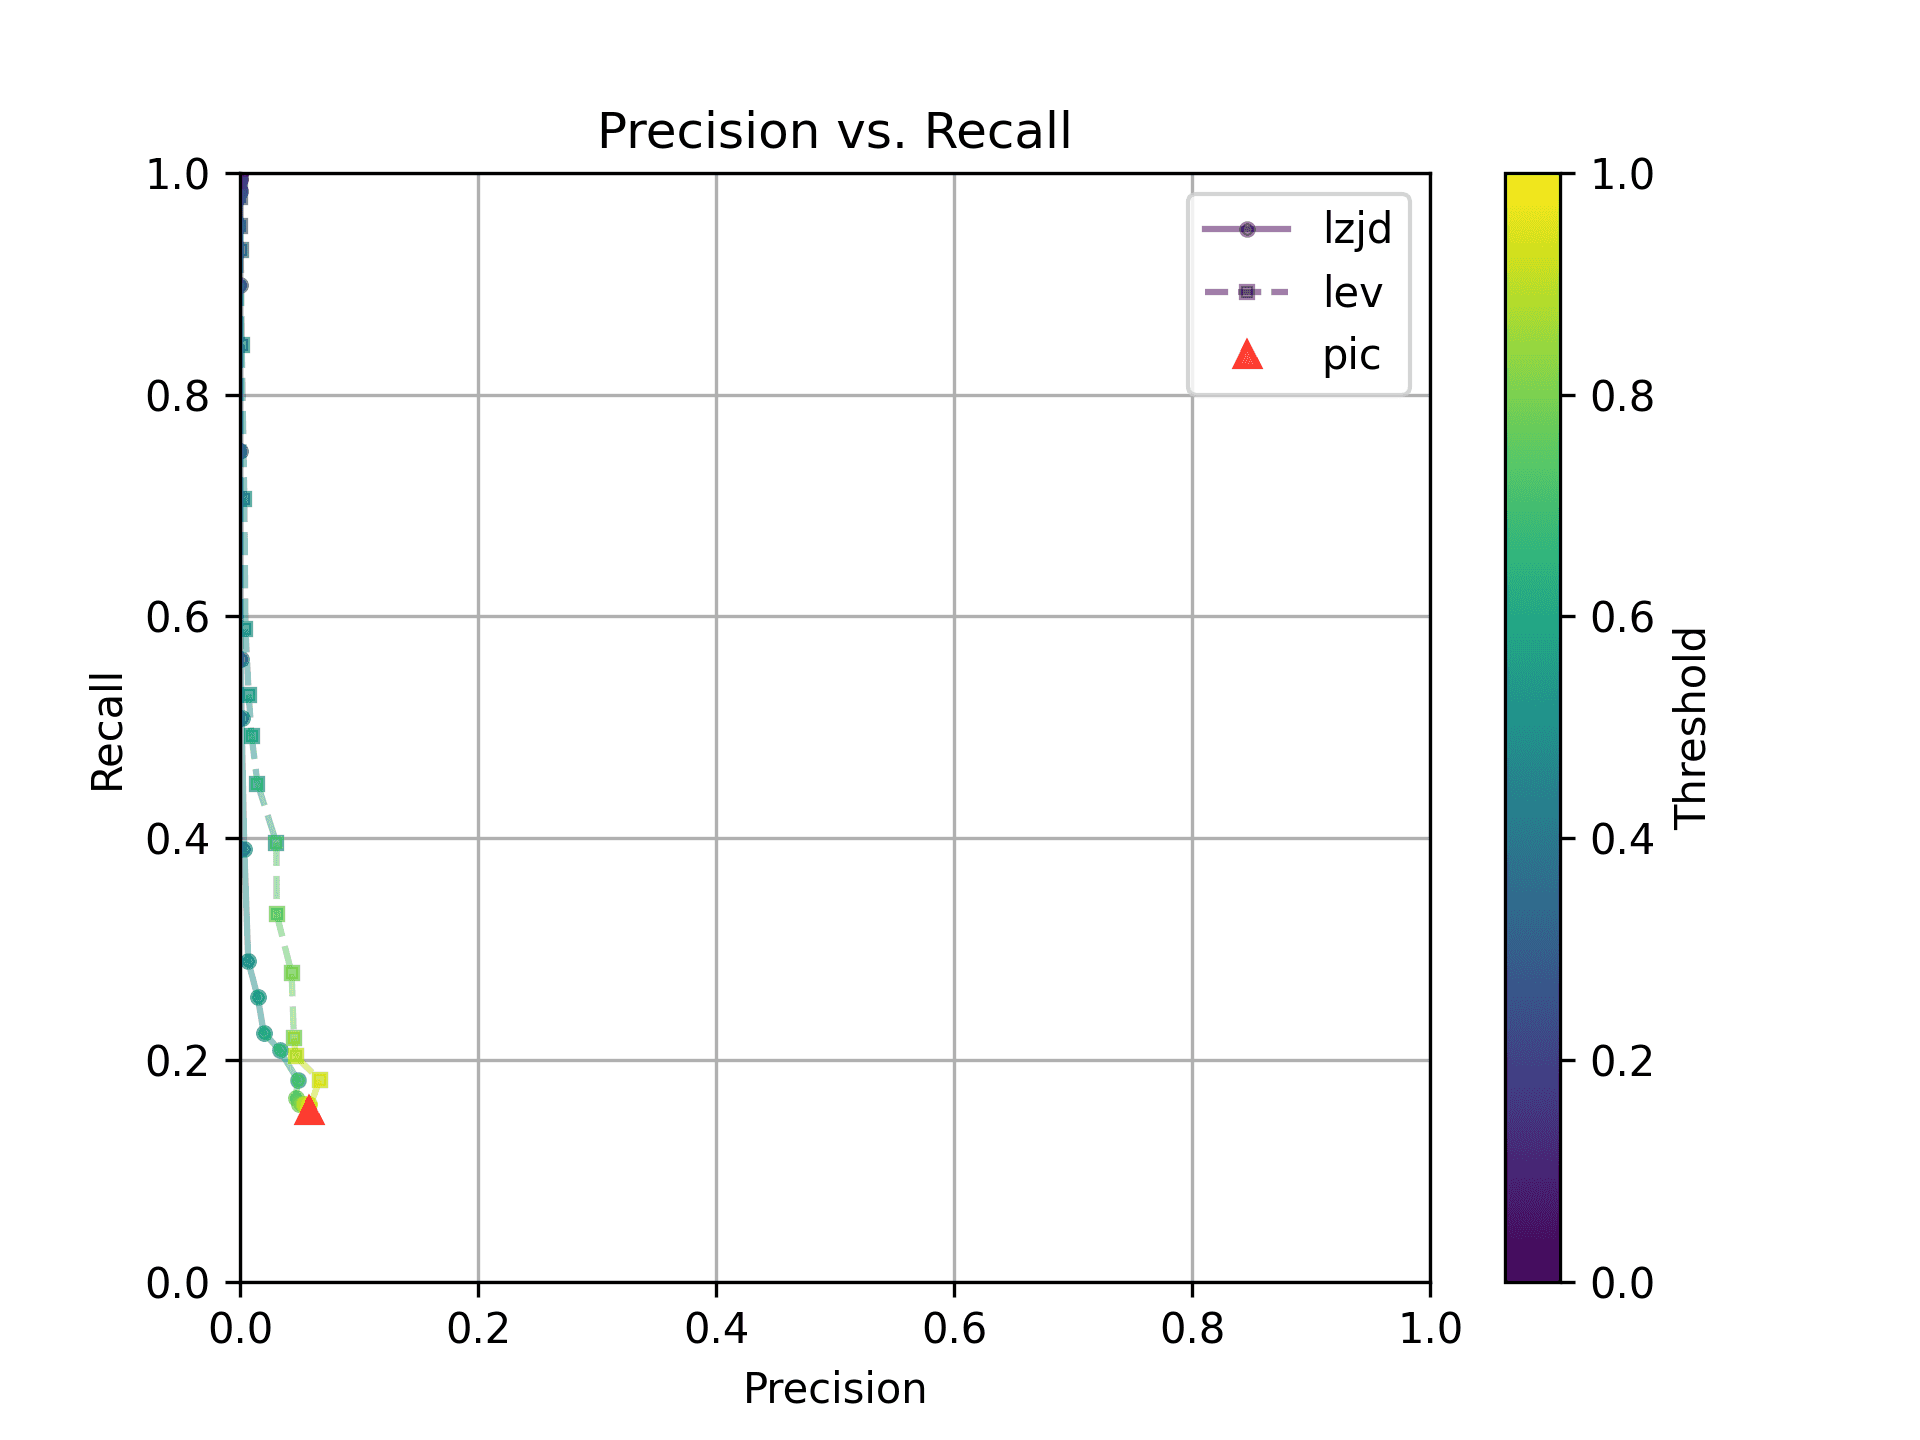
Finally, we'll look at 1.1.1v and 1.1.1w, which were released only a month apart.
Unsurprisingly, PIC hashing does even better here, with a precision of 0.82 and a recall of 1.0 (after rounding)! Again, there's basically no room for LZJD or LEV to improve.
This is another three way tie.
Conclusion
Thresholds in Practice
We saw some scenarios where LEV and LZJD outperformed PIC hashing. But it's important to realize that we are conducting these experiments with ground truth, and we're using the ground truth to select the optimal threshold. You can see these thresholds listed at the bottom of each violin plot. Unfortunately, if you look carefully, you'll also notice that the optimal thresholds are not always the same. For example, the optimal threshold for LZJD in the "openssl 1.0.2u vs 1.1.1w" experiment was 0.95, but it was 0.75 in the "openssl 1.1.1q vs 1.1.1w" experiment.
In the real world, to use LZJD or LEV, you need to select a threshold. Unlike in these experiments, you could not select the optimal one, because you would have no way of knowing if your threshold was working well or not! If you choose a poor threshold, you might get substantially worse results than PIC hashing!
PIC Hashing is Pretty Good
I think we learned that PIC hashing is pretty good. It's not perfect, but it generally provides excellent precision. In theory, LZJD and LEV can perform better in terms of recall, which is nice, but in practice, it's not clear that they would because you would not know which threshold to use.
And although we didn't talk much about performance, PIC hashing is very fast. Although LZJD is much faster than LEV, it's still not nearly as fast as PIC.
Imagine you have a database of a million malware function samples, and you have a function that you want to look up in the database. For PIC hashing, this is just a standard database lookup, which can benefit from indexes and other precomputation techniques. For fuzzy hash approaches, we would need to invoke the similarity function a million times each time we wanted to do a database lookup.
There's a Limit to Syntactic Similarity
Remember that we used LEV to represent the optimal similarity based on the edit distance of instruction bytes. That LEV did not blow PIC out of the water is very telling, and suggests that there is a fundamental limit to how well syntactic similarity based on instruction bytes can perform. And surprisingly to me, PIC hashing appears to be pretty close to that limit. We saw a striking example of this limit when the frame pointer was accidentally omitted, and more generally, all syntactic techniques struggle when the differences become too great.
I wonder if any variants, like computing similarities over assembly code instead of executable code bytes, would perform any better.
Where Do We Go From Here?
There are of course other strategies for comparing similarity, such as incorporating semantic information. Many researchers have studied this. The general downside to semantic techniques is that they are substantially more expensive than syntactic techniques. But if you're willing to pay the price, you can get better results. Maybe in a future blog post we'll try one of these techniques out, such as the one my contemporary and friend Wesley Jin proposed in his dissertation.
While I was writing this blog post, Ghidra 11.0 also introduced BSim:
A major new feature called BSim has been added. BSim can find structurally similar functions in (potentially large) collections of binaries or object files. BSim is based on Ghidra's decompiler and can find matches across compilers used, architectures, and/or small changes to source code.
Another interesting question is whether we can use neural learning to help compute similarity. For example, we might be able to train a model to understand that omitting the frame pointer does not change the meaning of a function, and so shouldn't be counted as a difference.
Hello, Merry Christmas and Happy Holidays! I just completed Advent of Code 2023, and wanted to jot down a few reflections before I disappear for the holidays. Like last year, I chose to implement my solutions using Rust.
Rust: easier with practice, but still a bit in the way
The good news is that I ran into far fewer problems with Rust this year. There
are a few reasons for this, but a lot of it just boils down to experience. I
tend to program excessively using lazy iterators, and I began to get a second
sense for when I'd need to call .collect() to avoid referencing a freed
temporary value. Similarly, when I would get a compiler error (and yes, this
still happens a lot!), I would often immediately know how to fix the problem.
That being said, there were still occasions when the language just "got in the
way". I had a few solutions where I had to throw in copious amounts of
.clone() calls. One salient example was on day
22
when I wanted to memoize a subproblem. But to do so, I also had to pass a value
instead of a reference to each sub-problem, which slowed things down
dramatically. Anyway, with more work, the solution probably would have been to
use references with lifetimes and just ensure that memoization happened during
the right lifetimes. But the key phrase there is with more work. And see
below
-- I was already pretty frustrated.
Chat-GPT and Co-pilot
On this year's Advent of Code, I used Chat-GPT and Co-pilot quite heavily, as I do in practice when coding. I used Chat-GPT mostly to avoid looking up documentation or crates. For example, "How can I add a progress indicator to an iterator in Rust?" or "How can I bind a sub-pattern to a name in Rust?". Given that I hadn't programmed in Rust for a year, I was a bit rusty (ha!)
Co-pilot was also quite useful. It was pretty good at writing out boilerplate code. Advent of Code problems tend to include copious amounts of grid problems, and Co-pilot reduced a lot of the fatigue for helper functions. Define things for the X axis, and it would figure out how to implement the other cases.
I also found that Co-pilot was able to explain weird Rust borrowing problems far
better than the compiler. As I wrote about last year, Rust's borrowing rules
sometimes don't work that great for my programming style, but Co-pilot was
pretty good about explaining problems. I don't have a specific example, but
think of searching a vector using vec.iter(), using the found value at some
point, and then later trying to move the vector. In my opinion, this definitely
makes it easier to program in Rust.
Now, Co-pilot did introduce some headaches as well. Although it was pretty
good, it would sometimes introduce problematic completions. For instance, it
really liked to complete print statements by adding an extra quote, e.g.,
println!("This is something: {:?}", something"); Not a huge deal, but it
happened enough that it was irritating.
Frustration and Clear-headedness: The Fine Line Between Perseverance and Stubbornness
On some level, I think everyone knows this, but it's still worth saying: You are more effective when thinking clearly. I recall from graduate school that many of my fellow students would pull all nighters and submit papers in the wee hours of the morning. I never did that. My efficiency just plummets as I get tired.
I experienced a pretty funny (in retrospect) example of this on day 22. You can read the problem, it's not really that hard. One of the nice things about programming functionally is that it usually works or completely fails. There's not a lot of in-between. In Advent of Code, this means that if your solution works on the example, it usually works on the real input (ignoring performance). But on day 22, my code did not work on the real input. The problem is pretty simple, so it was infuriating. Rather than taking a break to clear my head, I just kept trying to debug it. I stayed up far past my bed time, becoming more and more frustrated. I even completely rewrote my implementation in Python before giving up and going to bed.
The next morning, I woke up and looked at the problem again. I had a simple idea. I actually had two solutions to the problem. I had a simple but slow solution that I was confident was correct, but was too slow to use on the real input. And I had my fast solution that I thought should be correct, but wasn't. My insight was that I could make "in between" problems by just taking a portion of the real input -- say 10%. And then see if my fast solution agreed with the slow one. It didn't. I then ran Lithium and reduced the input to a minimal example. From here, it was trivial to spot the fundamental problem I had in my recursive algorithm. I fixed it, and my solution worked. This whole process probably only took 30 minutes from the time I woke up. I futilely spent hours the previous night. And the worst part is that, even in the moment, I knew I was acting foolishly. I was just too frustrated to stop.
I don't know if this is universal, but when I am stressed or frustrated, I usually make mistakes, which naturally compound my stress and frustration! There is a fine line between perseverance and stubbornness, and I crossed it on day 22.
I've been working on a blog post that has some interesting images in it. Unfortunately, my blog view is narrow, which makes it hard to see these. So, I decided to add a "click for full screen" feature to my blog. How hard could it be?
Answer: Very hard. Sadly, this took me a few days.
I hope to write a more detailed post about this later, but for now, I wanted to show off the fruits of my labor.
I can write:
<fsclick></fsclick>And you see:

Go ahead, click on it, I dare you! src
Powered with by Gatsby 5.0