
Motivation
In my last post, I ended with a question. My thought experiment had led me to believe that you can have structural equality of callee arguments or you can avoid executing callees, but not both. Is this actually true?
I've kept thinking about it, and I now think the answer is mostly no. If memory is equal, comparing pointers by address is okay, so we can sidestep structural equality entirely. There are some exceptions, though. As before, these are mostly notes for myself so that I don't forget my conclusions.
Compare memory, not arguments
To recap the problem, consider the example from last time:
int *foo(char *s);

int *f_reference(char *out) {
    strcpy(out, "hello");
    return foo(out);
}

int *f_candidate(char *out) {
    strcpy(out, "goodbye");
    return foo(out);
}
The calls to foo are physically equal (same out), but not structurally equal
(different strings). To check structural equality we would need to know how much
of *out foo reads, and we can't know that without looking inside foo.
Rather than trying to figure out what foo reads, which would require looking
at foo, we can instead require that everything foo could read is equal.
Specifically, at each call, check that:
- the arguments are physically equal, and
- all memory the callee could observe is equal in both executions.
If both hold, then foo receives identical inputs no matter how it uses the
pointer, so it's safe to give both executions the same (random, hashed)
response. This over-approximates the callee's read set, but it doesn't require
knowing anything about foo.
But this idea only works when equivalent code produces identical pointers. So when could two functions be equivalent and still have different pointers? I see two main cases: new memory that the candidate introduces itself (e.g., string literals), and implementation choices (e.g., mostly stack layout).
Exception 1: new memory in the candidate
The first case is memory that the candidate introduces itself, such as string literals. Our idea above is based on the assumption that all memory that a callee can read is equal. If the candidate introduces new memory segments, it breaks that assumption.
For example, suppose the target function calls printf("hello world\n"). The
original executable contains the literal "hello world\n" at some address in
its read-only data. When we compile the candidate, assuming it also contains
the literal "hello world\n", it receives its own, separate copy of the literal
at a different address. So printf receives different pointers in the two
executions, and a physical comparison of the arguments fails even though the
strings are identical.
Fortunately, constants are fairly easy to solve. Since constants are immutable, their identity is their content. We can find a correspondence before execution by searching the original binary's read-only sections for each of the candidate's constants, and then forcing the candidate to use the original's addresses instead. Then the arguments are physically equal and there's nothing to special-case at runtime.
Exception 2: stack layout
The second case is stack layout. Consider two decompilations of the same function that differ only in the order in which their locals are declared:
void g(char *);
int foo(char *);

int f_reference(void) {
    char a[8], b[8];
    g(a);
    g(b);
    return foo(b);
}

int f_candidate(void) {
    char b[8], a[8];   // same code, locals declared in the other order
    g(a);
    g(b);
    return foo(b);
}
C says nothing about where locals live, so these two functions are equivalent. Here's what gcc -O2
does with each of them, where S is the stack pointer at entry:
; f_reference
pushq  %rbp
subq   $16, %rsp        ; rsp = S-24
leaq   8(%rsp), %rbp    ; b = S-16
movq   %rsp, %rdi       ; a = S-24
call   g@PLT            ; g(a)
movq   %rbp, %rdi
call   g@PLT            ; g(b)
movq   %rbp, %rdi
call   foo@PLT          ; foo(S-16)

; f_candidate
pushq  %rbp
subq   $16, %rsp        ; rsp = S-24
movq   %rsp, %rbp       ; b = S-24
leaq   8(%rsp), %rdi    ; a = S-16
call   g@PLT            ; g(a)
movq   %rbp, %rdi
call   g@PLT            ; g(b)
movq   %rbp, %rdi
call   foo@PLT          ; foo(S-24)
Notice that the calls to foo are not physically equal: foo receives S-16
in one and S-24 in the other. Note that this is the same compiler at the
same optimization level: all I changed was the declaration order. A
decompilation recompiled with a different compiler, or with a slightly different
set of locals, can shift things around even more.
This problem is specific to the stack. Most other layout is decided by the linker: globals, functions and literals are placed at link time, so we can make the candidate use the original's addresses when we link it, as with the literals above. The frame layout, by contrast, is decided by the compiler inside each function, and there are no symbols we could bind. So the trouble is confined to stack addresses that escape.
Can we carve up the stack frame?
One idea is to carve the frame into objects and compare the object each escaped pointer refers to. But the frame is just bytes: it's hard to tell a scalar from a struct or an array, or where each object ends.
And even if we could carve perfectly, we can't tell how much the callee will read. A pointer to a struct is also a pointer to its first field:
struct point { int x, y; };
struct point p = { 1, 2 };
draw(&p);   // does draw read p.x (4 bytes) or all of p (8 bytes)?
And at the machine level, a callee given a stack pointer can read pretty much anything on the stack.
Conclusions and Questions
My personal conclusion is that this "compare memory, not arguments" idea is worth exploring. To that end, I have mocked up an interactive demo. There are built-in examples, but you can also upload your own (ELF x86-64 for now) binaries and candidate decompilations.
For now, I don't have a solution to the stack layout problem. This means that candidates that are equivalent except for their stack layout may be falsely reported as non-equivalent if they pass a pointer to the stack to a callee.
Motivation
I've been thinking a lot about verifying that a decompilation is "correct". This problem is becoming increasingly important because many neural decompilers produce output that is obviously incorrect. Wouldn't it be nice if we could detect these cases, either when evaluating decompilers for a paper, or in practice?
I have long wondered if we could use a simple dynamic technique to detect non-equivalent decompilations using something like Manuel Egele's blanket execution or Godefroid's micro execution. But every time that I think about this, I realize how many nuances there are, and I often forget my conclusions. The idea of this post is to write down some insights so that I remember them.
I would have liked to write a post that convinces someone other than me, but that was taking too long. So instead, this is mostly a set of observations recorded for myself. Maybe they will provide insight or make sense to others... I hope so, but I certainly understand if not.
The Idea
The idea starts by assigning random values to registers and executing a binary function concretely. When unassigned memory is referenced, intercept it and set it to something random. If both the reference decompilation and a candidate execute to an "equivalent" output state, the two programs are equivalent for that particular input. This is a cheap test, so we can run with a lot of different random inputs.
In other words, we replace the real callers with random ones.
Here's a simple example. Suppose the reference function is:
uint32_t f_reference(uint32_t a, uint32_t b) {
    return (a * 2654435761u) ^ ((b << 13) | (b >> 19));  // rotate b left 13
}
and a broken candidate decompilation:
uint32_t f_candidate(uint32_t a, uint32_t b) {
    return (a * 2654435761u) ^ (b << 13);  // BUG: rotate became a shift
}
For a random input a=0x6b8b4567, b=0x327b23c6, the reference returns
0xce416d78 and the candidate gives 0xce416b37. Clearly these are not
equivalent!
Things get a little more complicated when you have a function call. Blanket and micro execution both execute into the callee. But I really wanted to keep testing isolated to the function in question (the caller here).
So my idea was to model callees such that they return arbitrary but
deterministic values for each input combination (e.g., hash them). For example,
let's say we happened to call foo(10). We might hash foo(10) to the random
value 0x08cbc4a9. If the reference and candidate both call foo(10) and use
it in the same way, they should behave similarly.
Observations
Not executing callees
There are two problems if you try to avoid executing callees.
Structural vs. physical equality
The hashing scheme rests on an assumption: a callee invoked on the same input should return the same output. But what counts as "the same input"?
Consider:
int *foo(char *s);

int *f_reference(char *out) {
    strcpy(out, "hello");
    return foo(out);
}

int *f_candidate(char *out) {
    strcpy(out, "goodbye");
    return foo(out);
}
If we call f_reference and f_candidate on the same argument, are their
respective calls to foo on "the same input"? In a technical sense, the values
of out will be equal according to the == operator. Let's call this
physical equality.
But these two functions are obviously different, since out will point to
different strings; they are not structurally equal. And physical equality is
exactly what a hash of the argument registers gives us, so the hashing scheme
would declare these two functions equivalent.
To hash structurally instead, we would have to know how much of the buffer
matters. And without looking inside foo, we really can't tell how the pointer
is going to be used. Are all bytes going to be used up until a NULL terminator?
Or perhaps a fixed hard-coded number of bytes will be accessed. We can't know.
Conclusion: It's hard to achieve structural equality without examining callee functions.
Calling Conventions
Even determining the inputs and outputs of a callee function is not possible without examining it.
Here's an example that shows that you can't determine function signatures from looking at a function in isolation. Below are two programs. Both contain a caller and a callee. In the first program, the callee takes one argument:
long callee(long t) { return t * 3; }
long caller(long a, long c) { long v = c * c; return callee(a + v); }
gcc -O2 compiles caller to:
caller:
        imulq   %rsi, %rsi
        addq    %rsi, %rdi
        jmp     callee
In the second program, callee takes two:
long callee(long t, long v) { return t * 3 + v; }
long caller(long a, long c) { long v = c * c; return callee(a + v, v); }
gcc -O2 compiles this caller to the same three instructions:
caller:
        imulq   %rsi, %rsi
        addq    %rsi, %rdi
        jmp     callee
The two callers are indistinguishable, so we can't infer a callee's signature by
looking at the caller's code alone. We would at least need to look at callee.
This matters because hashing a call requires knowing what to hash. In the
first program %rsi is dead at the call; in the second it holds an argument.
Hash too little and we miss a real difference; hash too much and we report a
difference in a scratch register that nobody observes.
Contextual equivalence
I argue that the right definition of equivalence for decompilation is if you swap the decompiled function in for the original, nothing changes.
PL has a name for this idea: contextual equivalence. Two functions f and
g are contextually equivalent if, for every program context C, C[f] and
C[g] behave the same. The context is everything around the function: its
callers, its callees, and the globals.
The nice thing about contextual equivalence is that it only cares about what the
rest of the program can observe. It doesn't care which register holds a
temporary value, or at which stack offset a local variable lives. If the
candidate keeps a value in %rcx where the original used %rdx, or puts a
buffer at a different stack offset, that's fine, as long as nothing else in the
program can tell.
One of the benefits of contextual equivalence for decompilation is that it allows
us to define equivalence without talking about the rest of the program. For
example, suppose the reference function requires that its argument x is not
NULL:
int f_reference(int *x) {
    assert(x);
    return *x * 2;
}
Let's assume that, in the rest of the program, every caller respects this and passes a non-NULL argument.
Now consider a candidate that omits the check:
int f_candidate(int *x) {
    return *x * 2;
}
In this program, are f_reference and f_candidate equivalent? On one hand,
since callers never pass NULL, the assertion would never be triggered. We can
swap f_candidate in for f_reference in this program and the behavior won't
change. But establishing that requires understanding the entire program.
Contextual equivalence determines that these two functions are not equivalent
because there is a context where x is NULL that causes the behavior to differ,
even if this context does not occur in the particular program we are talking
about. I argue that this is a good thing for two reasons:
-
Reverse engineers seek to understand the behaviors that are present statically in machine code. Even if an
assertis "irrelevant", in many cases it is important to understand that it is present. Contextual equivalence gives us an elegant way to talk about what information is relevant. -
Because contextual equivalence is defined over any possible context, even those that are not possible in a specific program, we can decide whether two functions are contextually equivalent without analyzing the rest of the program. This is important because it allows us to think about functions in isolation.
Contextual equivalence at the executable level
There are some complications with applying contextual equivalence to executable code. In the examples above, I provided the reference as C source code, because I think it's easier to think about. There are actually two types of contexts: an abstract C context and an executable context. The glue between these two contexts is the ABI, which tells us how to map from the function prototype to the concrete (executable) context, but not the reverse. To say if two functions are contextually equivalent, we thus need to know their prototype.
The awkwardness in decompilation is that, in practice, the reference is assembly code. It doesn't have a prototype. The best prototype we have is from the candidate decompilation. Thus, the question of contextual equivalence becomes "Is decompilation D (and its prototype) a possible decompilation for reference machine code R?". And there can be multiple possible decompilations with different prototypes.
Another point of awkwardness is that contextual equivalence is defined in terms of a function in isolation, but recovering a prototype at the binary level requires inter-procedural analysis.
So, to recap:
-
Contextual equivalence allows us to think about a function's equivalence in isolation.
-
We care about the C context, so we need to know the reference function's C prototype.
-
We can't recover the function's C prototype by analyzing the function in isolation.
Put together, this is mildly circular: verifying a decompilation requires information that we can only get from the decompilation itself.
A downside to contextual equivalence
One downside to contextual equivalence is that it does not take implied preconditions into account. Consider a program that contains:
void scales_poorly(int x) {
    for (int i = 0; i < (1 << x); i++) {
        work(i);
    }
}
scales_poorly is obviously exponential in its argument, and the programmer
decided to only call it on small numbers as a result.
Unfortunately, contextual equivalence has no way of knowing this. A testing
technique based on random inputs might attempt to run scales_poorly on large
inputs, even though (1) it would be very expensive, and (2) the program does not
normally do this.
Symbolic execution could help this problem somewhat by forcing execution along short program paths instead of taking the paths of random inputs, but at the cost of significant engineering complexity.
Conclusions and Questions
-
Function prototypes are a parameter to the decompilation validation process. If you have ground truth source code, you should use the prototype from that. Otherwise, you can use the prototype from the candidate decompilation.
-
My thought experiment has led me to believe that you can have structural equality or you can avoid executing callees, but not both. Is this actually true?
In Part 1 and Part 2, I reported some peculiar behavior for quantized Qwen3.5-2B models. In Part 3 I moved to Qwen3.5-35B-A3B. Part 4 found that turning thinking off made the model better, and also turned up a llama.cpp tool-call parsing bug that was killing thinking runs outright. In Part 5 I ruled out sampling parameters as the explanation, and noticed that the thinking penalty was much worse on llama.cpp than on vllm. I blamed the parsing bug, but I didn't actually verify it.
This post has two parts. First, I upgraded llama.cpp and re-ran, which fixed the llama.cpp thinking penalty. Second, I tried to sweep across agents, which mostly didn't work.
Part 1: Upgrading llama.cpp
I re-ran the two presets that Qwen recommends, thinking-general and
nonthinking-reasoning, on a newer llama.cpp build. I also added a
Version column to the sweep summary, for reasons that are about to become
obvious.
| Run | Resolved | % | PPL | KL | Runtime | Version | Exceptions |
|---|---|---|---|---|---|---|---|
| thinking-general-BF16 | 254/500 | 50.8% | 6.62 | — | 1011m 32s | 0.1.2-dev (build 10540, commit 07822bddf) | Timeout(3), ExitCode(15), Reward(6), Verifier(1) |
| thinking-general-vllm | 250/500 | 50.0% | — | — | 1649m 0s | 0.20.2 | Timeout(43), ExitCode(26), Reward(2), Verifier(1) |
| nonthinking-reasoning-BF16 | 277/500 | 55.4% | 6.62 | 0.0000 | 1045m 22s | 0.1.2-dev (build 10540, commit 07822bddf) | Timeout(2), NetworkConnectionError(1), ExitCode(22), Reward(3), Verifier(1) |
| nonthinking-reasoning-vllm | 288/500 | 57.6% | — | — | 808m 25s | 0.20.2 | Timeout(9), NetworkConnectionError(1), ExitCode(22), Reward(3) |
The mystery is solved
Here is how these runs compare to the same four runs from Part 5:
| Run | Part 5 | Part 6 | Δ |
|---|---|---|---|
| thinking-general-BF16 | 187/500 (37.4%) | 254/500 (50.8%) | +13.4pp |
| thinking-general-vllm | 243/500 (48.6%) | 250/500 (50.0%) | +1.4pp |
| nonthinking-reasoning-BF16 | 264/500 (52.8%) | 277/500 (55.4%) | +2.6pp |
| nonthinking-reasoning-vllm | 276/500 (55.2%) | 288/500 (57.6%) | +2.4pp |
Only one number really moved: llama.cpp with thinking enabled, which gained 67 resolved instances. The other three deltas are small enough that I'd attribute them to ordinary run-to-run variation. So upgrading llama.cpp fixed the thinking parsing bug.
What this does to Part 5's findings
Part 5's Finding 2 was "the thinking penalty is worse on llama.cpp." With the newer build, that finding is gone:
| Backend | Non-thinking | Thinking | Penalty (pp) |
|---|---|---|---|
| llama.cpp BF16 | 277 (55.4%) | 254 (50.8%) | 4.6 |
| vllm | 288 (57.6%) | 250 (50.0%) | 7.6 |
Part 5's Finding 1, unfortunately, is untouched. Thinking still resolves fewer instances than non-thinking on both backends. That mystery is still open; the one I solved here is why the two backends disagreed about how much worse it was.
Part 2: Trying to sweep agents
Since Part
4
I've wanted to test agents other than openhands, which I originally picked
simply because it was the first one I could get working with
Harbor. So I ran several agents Harbor offers
against the same configuration: llama.cpp build 10540, BF16 GGUF, and the
nonthinking-reasoning preset.
| Run | Resolved | % | PPL | KL | Runtime | Version | Exceptions |
|---|---|---|---|---|---|---|---|
| openhands | 274/500 | 54.8% | 6.62 | — | 1096m 56s | 0.1.2-dev (build 10540, commit 07822bddf) | Timeout(4), ExitCode(19), Reward(1), Verifier(2) |
| opencode | 1/500 | 0.2% | 6.62 | 0.0000 | 199m 17s | 0.1.2-dev (build 10540, commit 07822bddf) | ExitCode(498) |
| mini-swe-agent | 308/500 | 61.6% | 6.62 | 0.0000 | 1228m 21s | 0.1.2-dev (build 10540, commit 07822bddf) | ExitCode(4), Reward(3) |
| hermes | 0/500 | 0.0% | 6.62 | 0.0000 | 197m 9s | 0.1.2-dev (build 10540, commit 07822bddf) | ApiRateLimitError(5), NetworkConnectionError(8), ExitCode(487) |
| pi | 0/500 | 0.0% | 6.62 | 0.0000 | 49m 6s | 0.1.2-dev (build 10540, commit 07822bddf) | ValueError(500) |
| claude-code | 1/500 | 0.2% | 6.62 | 0.0000 | 174m 47s | 0.1.2-dev (build 10540, commit 07822bddf) | AgentAuthenticationError(500) |
| codex | 1/500 | 0.2% | 6.62 | 0.0000 | 203m 47s | 0.1.2-dev (build 10540, commit 07822bddf) | ExitCode(500) |
Five of the seven agents failed on essentially every instance. The majority of these seem to be from Harbor's agent code bitrotting against the latest versions of those agents.
The agent matters more than anything else I've tested
The two agents that did work are interesting. mini-swe-agent resolved 308/500 (61.6%) against openhands' 274/500 (54.8%).
That is a 6.8pp swing from changing nothing but the scaffold, and it is the largest effect of any single knob I've tested in this entire series. For comparison, the difference between BF16, Q8_0, and Q5_K_M is usually a couple of points, and Part 5 showed that sampling presets barely register at all. 61.6% is also the best result I've gotten across all six posts. The previous best was the 57.6% from the vllm run above.
This is worth holding next to Qwen's claimed 70.0% on SWE-bench Verified. Their footnote says they used an "internal agent scaffold (bash + file-edit tools)," which is a much closer fit to mini-swe-agent's minimal design than of openhands.
Concluding Thoughts
The llama.cpp/vllm discrepancy from Part 5 was a llama.cpp bug, and upgrading fixes it. The thinking penalty itself is still there on both backends and I still don't know why.
Next Steps
I've now spent five posts on Qwen3.5-35B-A3B. It's time to point the harness at other models:
- Qwen3.5-27B, the dense model I've been meaning to test since Part 4.
- Newer Qwen3.6 and Qwen3.8 variants. Qwen3.6-35B-A3B is an obvious one. Qwen3.8 doesn't have any similarly sized MoE models, so Qwen3.8-27B is probably the next best option.
- Gemma 4. Part 1 opened with quantized Gemma 4 being completely unusable for coding agents, which is what motivated this whole project. It seems only fair to give it a proper measurement.
In Part 1 and Part 2, I reported some peculiar behavior for quantized Qwen3.5-2B models. In Part 3 I moved to Qwen3.5-35B-A3B, and in Part 4 I found that turning off thinking made the model better, which is surprising.
I also realized that I didn't use the same sampling presets that Qwen did. In
this post, I re-ran the sweep with all four sampling
presets:
thinking-general (1.0/0.95), thinking-coding (0.6/0.95),
nonthinking-general (0.7/0.8), and nonthinking-reasoning (1.0/0.95). Qwen's
footnote parameters correspond to thinking-general and nonthinking-reasoning
--- the two I hadn't used.
Sweep Summary
| Run | Resolved | % | PPL | KL | Runtime | Exceptions |
|---|---|---|---|---|---|---|
| nonthinking-general-BF16 | 272/500 | 54.4% | 6.62 | -0.0000 | 1114m 18s | Timeout(2), ExitCode(22), Reward(4), Verifier(1) |
| nonthinking-general-Q5_K_M | 250/500 | 50.0% | 6.62 | 0.0083 | 1027m 24s | Setup(1), Timeout(4), NetworkConnectionError(1), ExitCode(44), Reward(2), Verifier(1) |
| nonthinking-general-Q8_0 | 275/500 | 55.0% | 6.61 | 0.0068 | 976m 38s | Timeout(3), ExitCode(20), Reward(2), Verifier(2) |
| nonthinking-general-vllm | 269/500 | 53.8% | — | — | 928m 41s | Timeout(10), ExitCode(30), Reward(2), Verifier(1) |
| nonthinking-reasoning-BF16 | 264/500 | 52.8% | 6.62 | -0.0000 | 1114m 15s | Timeout(3), ExitCode(19), Reward(5) |
| nonthinking-reasoning-Q5_K_M | 264/500 | 52.8% | 6.62 | 0.0083 | 943m 24s | Timeout(2), ExitCode(19), Reward(5), Verifier(1) |
| nonthinking-reasoning-Q8_0 | 269/500 | 53.8% | 6.61 | 0.0068 | 950m 9s | Timeout(1), ExitCode(21), Reward(3), Verifier(2) |
| nonthinking-reasoning-vllm | 276/500 | 55.2% | — | — | 869m 14s | Timeout(13), ExitCode(19), Reward(1), Verifier(1) |
| thinking-coding-BF16 | 183/500 | 36.6% | 6.62 | -0.0000 | 1428m 38s | Timeout(23), ExitCode(17), Reward(2), Verifier(1) |
| thinking-coding-Q5_K_M | 198/500 | 39.6% | 6.62 | 0.0083 | 1040m 1s | Timeout(12), ExitCode(24), Reward(4), Verifier(1) |
| thinking-coding-Q8_0 | 196/500 | 39.2% | 6.61 | 0.0068 | 971m 55s | Timeout(10), ExitCode(20), Reward(2), Verifier(1) |
| thinking-coding-vllm | 254/500 | 50.8% | — | — | 1619m 34s | Timeout(40), ExitCode(21), Reward(3), Verifier(1) |
| thinking-general-BF16 | 187/500 | 37.4% | 6.62 | — | 1049m 8s | Timeout(5), NetworkConnectionError(1), ExitCode(20), Reward(4), Verifier(1) |
| thinking-general-Q5_K_M | 199/500 | 39.8% | 6.62 | 0.0083 | 573m 14s | ExitCode(19), Reward(2), Verifier(1) |
| thinking-general-Q8_0 | 211/500 | 42.2% | 6.61 | 0.0068 | 711m 51s | Timeout(2), ExitCode(19), Reward(4), Verifier(1) |
| thinking-general-vllm | 243/500 | 48.6% | — | — | 1694m 29s | Timeout(47), ExitCode(20), Verifier(1) |
Finding 1: Sampling parameters are not the explanation
Summing each preset across all four backends:
| Preset | Resolved | % |
|---|---|---|
| nonthinking-reasoning | 1073/2000 | 53.6% |
| nonthinking-general | 1066/2000 | 53.3% |
| thinking-general | 840/2000 | 42.0% |
| thinking-coding | 831/2000 | 41.5% |
Non-thinking runs consistently perform significantly better than thinking runs.
In contrast, the sampling parameters don't seem to matter very much.
So the results from Part 4 do not seem to be a mistake caused by using the wrong sampling parameters.
Finding 2: The thinking penalty is worse on llama.cpp
Averaging each backend's two non-thinking runs against its two thinking runs:
| Backend | Non-thinking avg | Thinking avg | Penalty (pp) |
|---|---|---|---|
| llama.cpp BF16 | 268.0 | 185.0 | 16.6 |
| llama.cpp Q8_0 | 272.0 | 203.5 | 13.7 |
| llama.cpp Q5_K_M | 257.0 | 198.5 | 11.7 |
| vllm | 272.5 | 248.5 | 4.8 |
I would expect:
- The non-quantized (vllm) run should out-perform the other runs
- llama.cpp's BF16 run should be fairly close to vllm
- More quantization should lead to lower accuracy, though there is evidence this is not always true
For non-thinking runs, this is spot on, considering a small amount of noise. But thinking runs are different: vllm does significantly better. This is probably because of the llama.cpp parsing bug discovered in Part 4.
Concluding Thoughts
Despite being significantly more expensive, thinking mode seems to be worse for coding, which still surprises me. This clearly isn't true for frontier models.
Sampling parameters don't seem to be that critical. Whether thinking is enabled is much more impactful.
The best run here is nonthinking-reasoning-vllm at 55.2%, compared to Qwen's
claimed 70.0%. It's still unclear what the difference is.
I previously wrote about OOAnalyzer-ASP, an experimental reimagining of the OOAnalyzer tool using Answer Set Programming. I have bad news: I have stopped working on it for now. I am not sure that anyone besides me will really care, but I'll post this here because I will almost certainly forget the details of why I stopped working on it if I don't write them down.
Performance Problems
The ASP implementation I was using, clingo, is a tight integration of a grounder and a solver. The grounder converts the ASP program into the constraint language expected by the solver. The solver is similar to a SAT solver, but is specialized for Answer Set Programming. One of the reasons I was interested in using ASP is that it uses a concept from SAT, conflict-driven clause learning (CDCL), to prune the search space. This is something that is sorely missing in OOAnalyzer, which only explores the search space to a depth of one. I was hoping that CDCL would be able to efficiently tease out facts that had to be true in order for the program to be consistent.
Grounding
Sadly, there were a few problems with this. The first problem is the grounding process itself. To oversimplify, grounding is a process that removes variables from logic programs. Let's say that we have the following logic program:
foo(ed).
bar(X) :- foo(X).
The grounded version of this program would be:
foo(ed).
bar(ed) :- foo(ed).
The challenge with grounding is that it can lead to a combinatorial explosion in the size of the grounded program. And to make a long story short, because class identities in OOAnalyzer are variable, each potential class identity would amount to grounded facts. This was a constant tension, as I was often thinking about the impact on grounding when I was designing the ASP rules.
Large Lemmas
The second performance problem was related to the solver. I found that it worked very well for small programs, but for medium-sized programs, the solver would often stop making progress. It was possible to eek out better solutions by tuning parameters, but it always seemed like it was only exploring a limited portion of the search space.
As clingo runs, it tries to solve a formula saying "find a model that satisfies all of these constraints, and has a model reward/score of at least X". Once X reaches a certain magnitude, this becomes very difficult to solve because a small portion of the search space will score at least X. More problematically, the conditions required to reach X are very complex and interdependent. This too is very impacted by OOAnalyzer's dynamic class identities. At the solver level, when it finds a portion of the search space that is unsatisfiable, it mechanically generates a lemma that describes it to prevent the solver from exploring that portion of the search space again.
In OOAnalyzer-ASP, these lemmas were often huge, which means that they were very specific to the particular model being solved. At a high level, they might say that "if you have a class consisting of exactly these methods, then you can't have a reward of X", rather than a more general lemma that says "if method A and B are on different classes, you can't have a reward of X". What is supposed to happen is that over time, the lemmas accumulate and new lemmas become smaller and more general, until the lemmas cover the entire search space.
The problem is that solvers remove lemmas over time to speed up the search process. At a certain point, this is at tension with the overall learning process. If lemmas are removed before the smaller, more general lemmas are learned, then the solver will have to re-learn the same lemmas over and over again. It stops making progress. This is what was happening in OOAnalyzer-ASP. I think it is probably possible to tune the solver to avoid this, but the next problem in OOAnalyzer-ASP was more pressing.
Articulation Challenges
The second major problem with OOAnalyzer-ASP was that it was difficult to adequately express some properties in ASP. More specifically, as I was fighting the above performance problems, I would often convince the solver to find a model with a better score. Unfortunately, when I actually compared the better scoring model with the ground truth, it would often be slightly worse. It was very difficult to actually construct the model scoring to reflect reality.
One of the reasons for this has to do with fixed points. OOAnalyzer represents classes as sets of methods that are iteratively merged. In Prolog, it is possible to reason about the membership of the current class at each step of the iteration. For example, OOAnalyzer has a few rules that are conditioned on one class only containing a single class. In ASP, class membership is represented as a fixed point, which means that class properties must be monotonic over merging. There is not an easy way to express the fact that a class only contains a single method at some point in time, because the rules can only reason about the final fixed point.
Imagine you had a program like this:
merge(A,B) :- class(A), class(B), hasAConstructor(A), hasADestructor(B), size(B) = 1.In ASP, after merging A and B, size(B) = 1 would become false, and this line
of reasoning would vanish.
In theory, it is possible to represent the entire history of the merging process in ASP by modeling the entire sequence of merges, but this would further compound the grounding performance problem!
Conclusion
I don't think that OOAnalyzer-ASP is a complete dead-end, but it's not the slam dunk I was hoping it would be.
As part of this process, I also spent a lot of time looking at the mistakes OOAnalyzer and OOAnalyzer-ASP made. There is less room for improvement than I expected. That doesn't mean that OOAnalyzer is perfect, but rather, after looking at the available evidence, I am not sure how as a human to do much better. I honestly expected that OOAnalyzer's limited searching ability would have a larger impact than it does.
In Part 1 and Part 2, I reported some peculiar behavior for quantized Qwen3.5-2B models. In Part 3, I reported results for a larger variant, Qwen3.5-35B-A3B, with thinking enabled.
In this post, we'll take a look at performance with thinking enabled vs. disabled.
Sweep Summary
| Run | Resolved | % | PPL | KL | Runtime | Exceptions |
|---|---|---|---|---|---|---|
| thinking-BF16 | 173/500 | 34.6% | 6.62 | — | 1392m 16s | Timeout(15), ExitCode(22), Reward(2), Verifier(1) |
| thinking-Q5_K_M | 180/500 | 36.0% | 6.62 | 0.0083 | 1046m 35s | Timeout(8), ExitCode(19), Reward(5) |
| thinking-Q8_0 | 193/500 | 38.6% | 6.61 | 0.0068 | 1646m 39s | Setup(7), Timeout(12), ExitCode(18), Reward(4), Verifier(1) |
| thinking-vllm | 233/500 | 46.6% | — | — | 1753m 3s | Timeout(41), NetworkConnectionError(1), ExitCode(28), Reward(3), Verifier(1) |
| nonthinking-BF16 | 273/500 | 54.6% | 6.62 | -0.0000 | 1104m 26s | Timeout(1), ExitCode(22), Reward(2), Verifier(1) |
| nonthinking-Q8_0 | 260/500 | 52.0% | 6.61 | 0.0068 | 890m 2s | Timeout(2), ExitCode(18), Reward(2), Verifier(1) |
| nonthinking-Q5_K_M | 263/500 | 52.6% | 6.62 | 0.0083 | 877m 18s | Timeout(2), ExitCode(23), Reward(6), Verifier(1) |
| nonthinking-vllm | 269/500 | 53.8% | — | — | 734m 0s | Timeout(4), ExitCode(33), Reward(1), Verifier(1) |
Analysis
As expected, the thinking runs took longer to complete than the non-thinking runs. But unexpectedly, non-thinking runs outperformed thinking runs across the board. This is counterintuitive, since we would expect that thinking would improve performance. That is how it's supposed to work!
One concern I had with this experiment was whether timeouts were affecting the results, that is, if given enough time, the thinking runs would eventually outperform the non-thinking runs. I actually ended up running this several times, eventually with quite long timeouts. Most of the remaining timeouts were due to thinking loops rather than legitimate reasoning timeouts. So endless loops are a concern with this particular model on thinking runs. But we see more differences in performance --- exactly 100 more problems were resolved by nonthinking-BF16 than thinking-BF16 --- that can't be explained by the 15 observed timeouts in the thinking-BF16 run.
I asked AI to analyze the results and it found two problems.
Problem 1: Tool-call parsing
In thinking mode, llama.cpp is experiencing a malformed tool-call parse crash that is causing a large number of failures. These failures cause openhands to exit.
I can trigger this behavior using this script:
=== firing the same clean real prompt 10 times ===
POST http://172.17.0.2:8085/v1/chat/completions x 10

  probe 1: EXTRACTED (str_replace_editor)
  probe 2: EXTRACTED (str_replace_editor)
  probe 3: EMPTY (finish_reason=stop, no content, no reasoning)
  probe 4: EMPTY (finish_reason=stop, no content, no reasoning)
  probe 5: CRASH (500: Failed to parse input at pos 49: <tool_call>
<function=str_replace_editor>
<parameter=command>
view
)
  probe 6: EMPTY (finish_reason=stop, no content, no reasoning)
  probe 7: EMPTY (finish_reason=stop, no content, no reasoning)
  probe 8: CRASH (500: Failed to parse input at pos 49: <tool_call>
<function=str_replace_editor>
<parameter=command>
view
)
  probe 9: EMPTY (finish_reason=stop, no content, no reasoning)
  probe 10: EMPTY (finish_reason=stop, no content, no reasoning)

  -> extracted: 2/10, stuck: 0/10, crash: 2/10, empty: 6/10, other: 0/10
So out of 10 queries, we get the failure to parse twice, and then an empty response 6 times. Something is clearly going wrong!
With the help of AI, I was able to attribute many of the problems to a grammar
problem. The model often emits a redundant <thinking> tag, which causes
llama.cpp's parser to fail. As you can see in this AI-generated table, this
happens very frequently:
| Model | Resolved | Harbor exception¹ | Parse-crash² | Stuck-loop³ | Other silent-crash⁴ | Unexplained⁵ |
|---|---|---|---|---|---|---|
| BF16 | 173 | 35 | 144 | 85 | 1 | 62 |
| Q8_0 | 193 | 39 | 99 | 107 | 1 | 61 |
| Q5_K_M | 180 | 31 | 96 | 135 | 3 | 55 |
| vLLM | 233 | 65 | 0 | 91 | 13 | 98 |
¹ Timeout/ExitCode/Setup/Reward/Verifier/NetworkConnectionError — the only category Harbor's own exit-code-based detection actually catches.
² llama.cpp's PEG parser crash (Failed to parse input at pos N), trial ended fatally right there. Zero on vLLM.
³ OpenHands' AgentStuckInLoopError killed the attempt.
⁴ Other unrelated fatal errors (mostly the chardet/action-execution-server bug on vLLM).
⁵ Attempts that neither resolved, hit a Harbor exception, nor showed any of the fatal patterns checked — genuinely completed but produced a wrong patch, or a crash pattern not yet characterized.
Problem 2: Harbor error handling
The second problem is that Harbor does not detect the error. And it seems that this is because openhands returns exit code 0.
What a mess!
Concluding Thoughts
We can't detect the redundant <thinking> tag problem in vllm, but it could
still be happening (update: it is happening). vllm has a different tool parsing
mechanism than llama.cpp; it might be more forgiving (update: it is). For
whatever reason, vllm-thinking is still underperforming vllm-nonthinking.
According to Qwen's blog post, Qwen3.5-35B-A3B scores 70.0% on SWE-bench Verified. There is a small footnote too:
SWE-Bench Series: Internal agent scaffold (bash + file-edit tools); temp=1.0, top_p=0.95, 200K context window. We correct some problematic tasks in the public set of SWE-bench Pro and evaluate all baselines on the refined benchmark.
I'm not going to comment on the "correct some problematic tasks" part.
That temperature of 1.0 and top_p of 0.95 are recommended by Qwen for both thinking "general tasks" (as opposed to "precise coding tasks") and non-thinking "reasoning tasks" (as opposed to "general tasks"). Unfortunately, as you can see here, for these results I used "precise coding tasks" and "general tasks", which both use different temperature and top_p settings. If you are wondering why SWE-Bench Verified is not considered a "precise coding task"... well, so am I. Ask Qwen! IMHO, models should have a single set of recommended parameters for all tasks, and the model should be able to handle the task type automatically.

Next Steps
-
I am going to try to confirm whether the redundant
<thinking>tag is generated by vllm-thinking. If it is, then it suggests that the model is buggy. Which would be weird --- the model defaults to thinking. (Update: I confirmed that vllm-thinking does generate the redundant<thinking>tag, so its parser must be more forgiving than llama.cpp's parser.) -
I am going to rerun the experiments with all four parameter settings that Qwen recommends, since I apparently chose different ones than Qwen did when they tested SWE-Bench Verified.
-
I'm will test the dense model Qwen3.5-27B.
-
I am also going to investigate agents other than openhands. I originally selected openhands because it is the first agent I was able to get to work with Harbor. But at the time, Harbor was only compatible with an older branch of openhands. Hopefully this has changed, or a more reasonable harness like opencode will work now.
In Part 1 and Part 2, I reported some peculiar behavior for quantized Qwen3.5-2B models. In Part 3 Take 1, I reported early results for a larger variant: Qwen3.5-35B-A3B. But I recently discovered that this experiment had a problem that may have been contributing to Timeouts.
The Issue
Qwen3.5 can be used in either "thinking" or "non-thinking" mode. Small models like Qwen3.5-2B default to non-thinking mode, but larger models like Qwen3.5-35B default to thinking mode. When I switched to testing Qwen3.5-35B-A3B, I did not realize that the default mode had changed. That's the first problem; we were testing Qwen3.5-2B without thinking against Qwen3.5-35B-A3B with thinking. The second problem is that Qwen recommends different sampling parameters for thinking vs. non-thinking mode. So we were using a non-thinking sampling configuration with a thinking model. This is likely to have contributed to the Timeouts we observed in Take 1. Manual analysis revealed that many of these cases were indeed thinking loops, which is consistent with the fact that we were using an invalid sampling configuration with a thinking model.
So, mea culpa. Fortunately, I noticed this problem because I wondered why vllm had so many Timeouts and investigated further. I think this is a good example of why we need to conduct and automate these experiments. It's easy to make mistakes when running these experiments manually, and automation can help catch these issues, or at least make sure we don't repeat them once we noticed the problem. And even if you aren't running experiments, it's easy to accidentally use a model with unsupported parameters and get poor results. So it's important to understand the model and make sure you are running with all of the correct parameters.
Take Two
So let's try this again but explicitly set the model to thinking mode and use the recommended sampling parameters for thinking. Recall that we were attempting to see whether the trends we observed for Qwen3.5-2B would hold for Qwen3.5-35B-A3B:
- KL divergence did not reliably predict downstream coding-agent performance.
- Some quantizations outperformed the original model, while others underperformed.
Old, Invalid Results
Here was the old, invalid run summary from Take 1:
| Run | Resolved | % | PPL | KL | Runtime | Exceptions |
|---|---|---|---|---|---|---|
| BF16 | 181/500 | 36.2% | 6.62 | — | 2103m 41s | Timeout(275), ExitCode(17), Reward(3), Verifier(1) |
| Q5_K_M | 194/500 | 38.8% | 6.62 | 0.0083 | 531m 46s | Timeout(8), ExitCode(23), Reward(3), Verifier(1) |
| Q8_0 | 202/500 | 40.4% | 6.61 | 0.0068 | 575m 45s | Timeout(11), ExitCode(24), Reward(1), Verifier(1) |
| vllm | 230/500 | 46.0% | — | — | 1634m 13s | Timeout(145), ExitCode(22), Reward(6) |
And here were the key takeaways from Take 1:
vllmcurrently leads this sweep at 46.0% resolved.- Q8_0 and Q5_K_M both outperform the GGUF BF16 variant in resolved rate.
- BF16 and
vllmshow many more timeouts than the quantized GGUF variants. - Public benchmark numbers for this model are meaningfully higher than what I observe locally.
New, Corrected Results
Let's look at the corrected (hopefully) results from Take 2. Here is the new run summary:
| Run | Resolved | % | PPL | KL | Runtime | Exceptions |
|---|---|---|---|---|---|---|
| BF16 | 174/500 | 34.8% | 6.62 | — | 1451m 33s | AddTestsDirError(1), Timeout(24), ExitCode(20), Reward(2) |
| Q5_K_M | 187/500 | 37.4% | 6.62 | 0.0083 | 978m 48s | Timeout(11), ExitCode(19), Reward(1), Verifier(1) |
| Q8_0 | 181/500 | 36.2% | 6.61 | 0.0068 | 989m 28s | Timeout(7), ExitCode(24), Reward(1) |
| vllm | 249/500 | 49.8% | — | — | 1605m 47s | Timeout(42), ExitCode(19), Reward(5), Verifier(2) |
New takeaways:
vllmstill leads this sweep at 49.8% resolved.- Q5_K_M and Q8_0 still outperform the GGUF BF16 variant in resolved rate.
- BF16 and
vllmstill show more timeouts than the quantized GGUF variants, but the gap is much smaller than in Take 1. Manual analysis showed that the models were still making progress rather than being stuck in loops. - Public benchmark numbers for this model are meaningfully higher than what I observe locally.
If you look closely, the takeaways are essentially the same. Oddly enough,
vllm improved its performance with the correct configuration, while the GGUF
variants all performed worse.
Observations
Behavior differs from Qwen3.5-2B
With Qwen3.5-2B, the smaller GGUF quantizations (Q5_K_M, Q8_0) outperformed both GGUF BF16 and the vllm model. Qwen3.5-35B-A3B shows a similar pattern, but the vllm model outperforms all the GGUF variants.
GGUF BF16 vs original checkpoint is still surprising
There is a notable gap between GGUF BF16 results and the original model results. That is surprising because the original checkpoint is mostly BF16 with a small number of F32 tensors. I checked the GGUF contents and confirmed F32 tensors are present:
vscode ➜ /workspaces/auto-bench (main) $ gguf-dump /home/vscode/.cache/huggingface/hub/models--unsloth--Qwen3.5-35B-A3B-GGUF/snapshots/bc014a17be43adabd7066b7a86075ff935c6a4e2/BF16/Qwen3.5-35B-A3B-BF16-00002-of-00002.gguf | grep "F32" | head -20
INFO:gguf-dump:* Loading: /home/vscode/.cache/huggingface/hub/models--unsloth--Qwen3.5-35B-A3B-GGUF/snapshots/bc014a17be43adabd7066b7a86075ff935c6a4e2/BF16/Qwen3.5-35B-A3B-BF16-00002-of-00002.gguf
    142:       2048 |  2048,     1,     1,     1 | F32     | blk.0.attn_norm.weight
    143:         32 |    32,     1,     1,     1 | F32     | blk.0.ssm_a
    144:      32768 |     4,  8192,     1,     1 | F32     | blk.0.ssm_conv1d.weight
    145:         32 |    32,     1,     1,     1 | F32     | blk.0.ssm_dt.bias
    148:        128 |   128,     1,     1,     1 | F32     | blk.0.ssm_norm.weight
    149:     524288 |  2048,   256,     1,     1 | F32     | blk.0.ffn_gate_inp.weight
    153:       2048 |  2048,     1,     1,     1 | F32     | blk.0.ffn_gate_inp_shexp.weight
    154:       2048 |  2048,     1,     1,     1 | F32     | blk.0.post_attention_norm.weight
    155:       2048 |  2048,     1,     1,     1 | F32     | blk.1.attn_norm.weight
    156:         32 |    32,     1,     1,     1 | F32     | blk.1.ssm_a
    157:      32768 |     4,  8192,     1,     1 | F32     | blk.1.ssm_conv1d.weight
    158:         32 |    32,     1,     1,     1 | F32     | blk.1.ssm_dt.bias
    161:        128 |   128,     1,     1,     1 | F32     | blk.1.ssm_norm.weight
    162:     524288 |  2048,   256,     1,     1 | F32     | blk.1.ffn_gate_inp.weight
    166:       2048 |  2048,     1,     1,     1 | F32     | blk.1.ffn_gate_inp_shexp.weight
    167:       2048 |  2048,     1,     1,     1 | F32     | blk.1.post_attention_norm.weight
    168:       2048 |  2048,     1,     1,     1 | F32     | blk.10.attn_norm.weight
    169:         32 |    32,     1,     1,     1 | F32     | blk.10.ssm_a
    170:      32768 |     4,  8192,     1,     1 | F32     | blk.10.ssm_conv1d.weight
    171:         32 |    32,     1,     1,     1 | F32     | blk.10.ssm_dt.bias
In fact, some tensors appear upcast to F32 in the GGUF file, so raw dtype alone does not explain the performance gap.
Vendor-reported benchmark numbers are much higher
According to Qwen's benchmark page, Qwen3.5-35B-A3B achieves 69.2% on SWE-bench Verified. That is substantially higher than the 49.8% best result in this sweep.
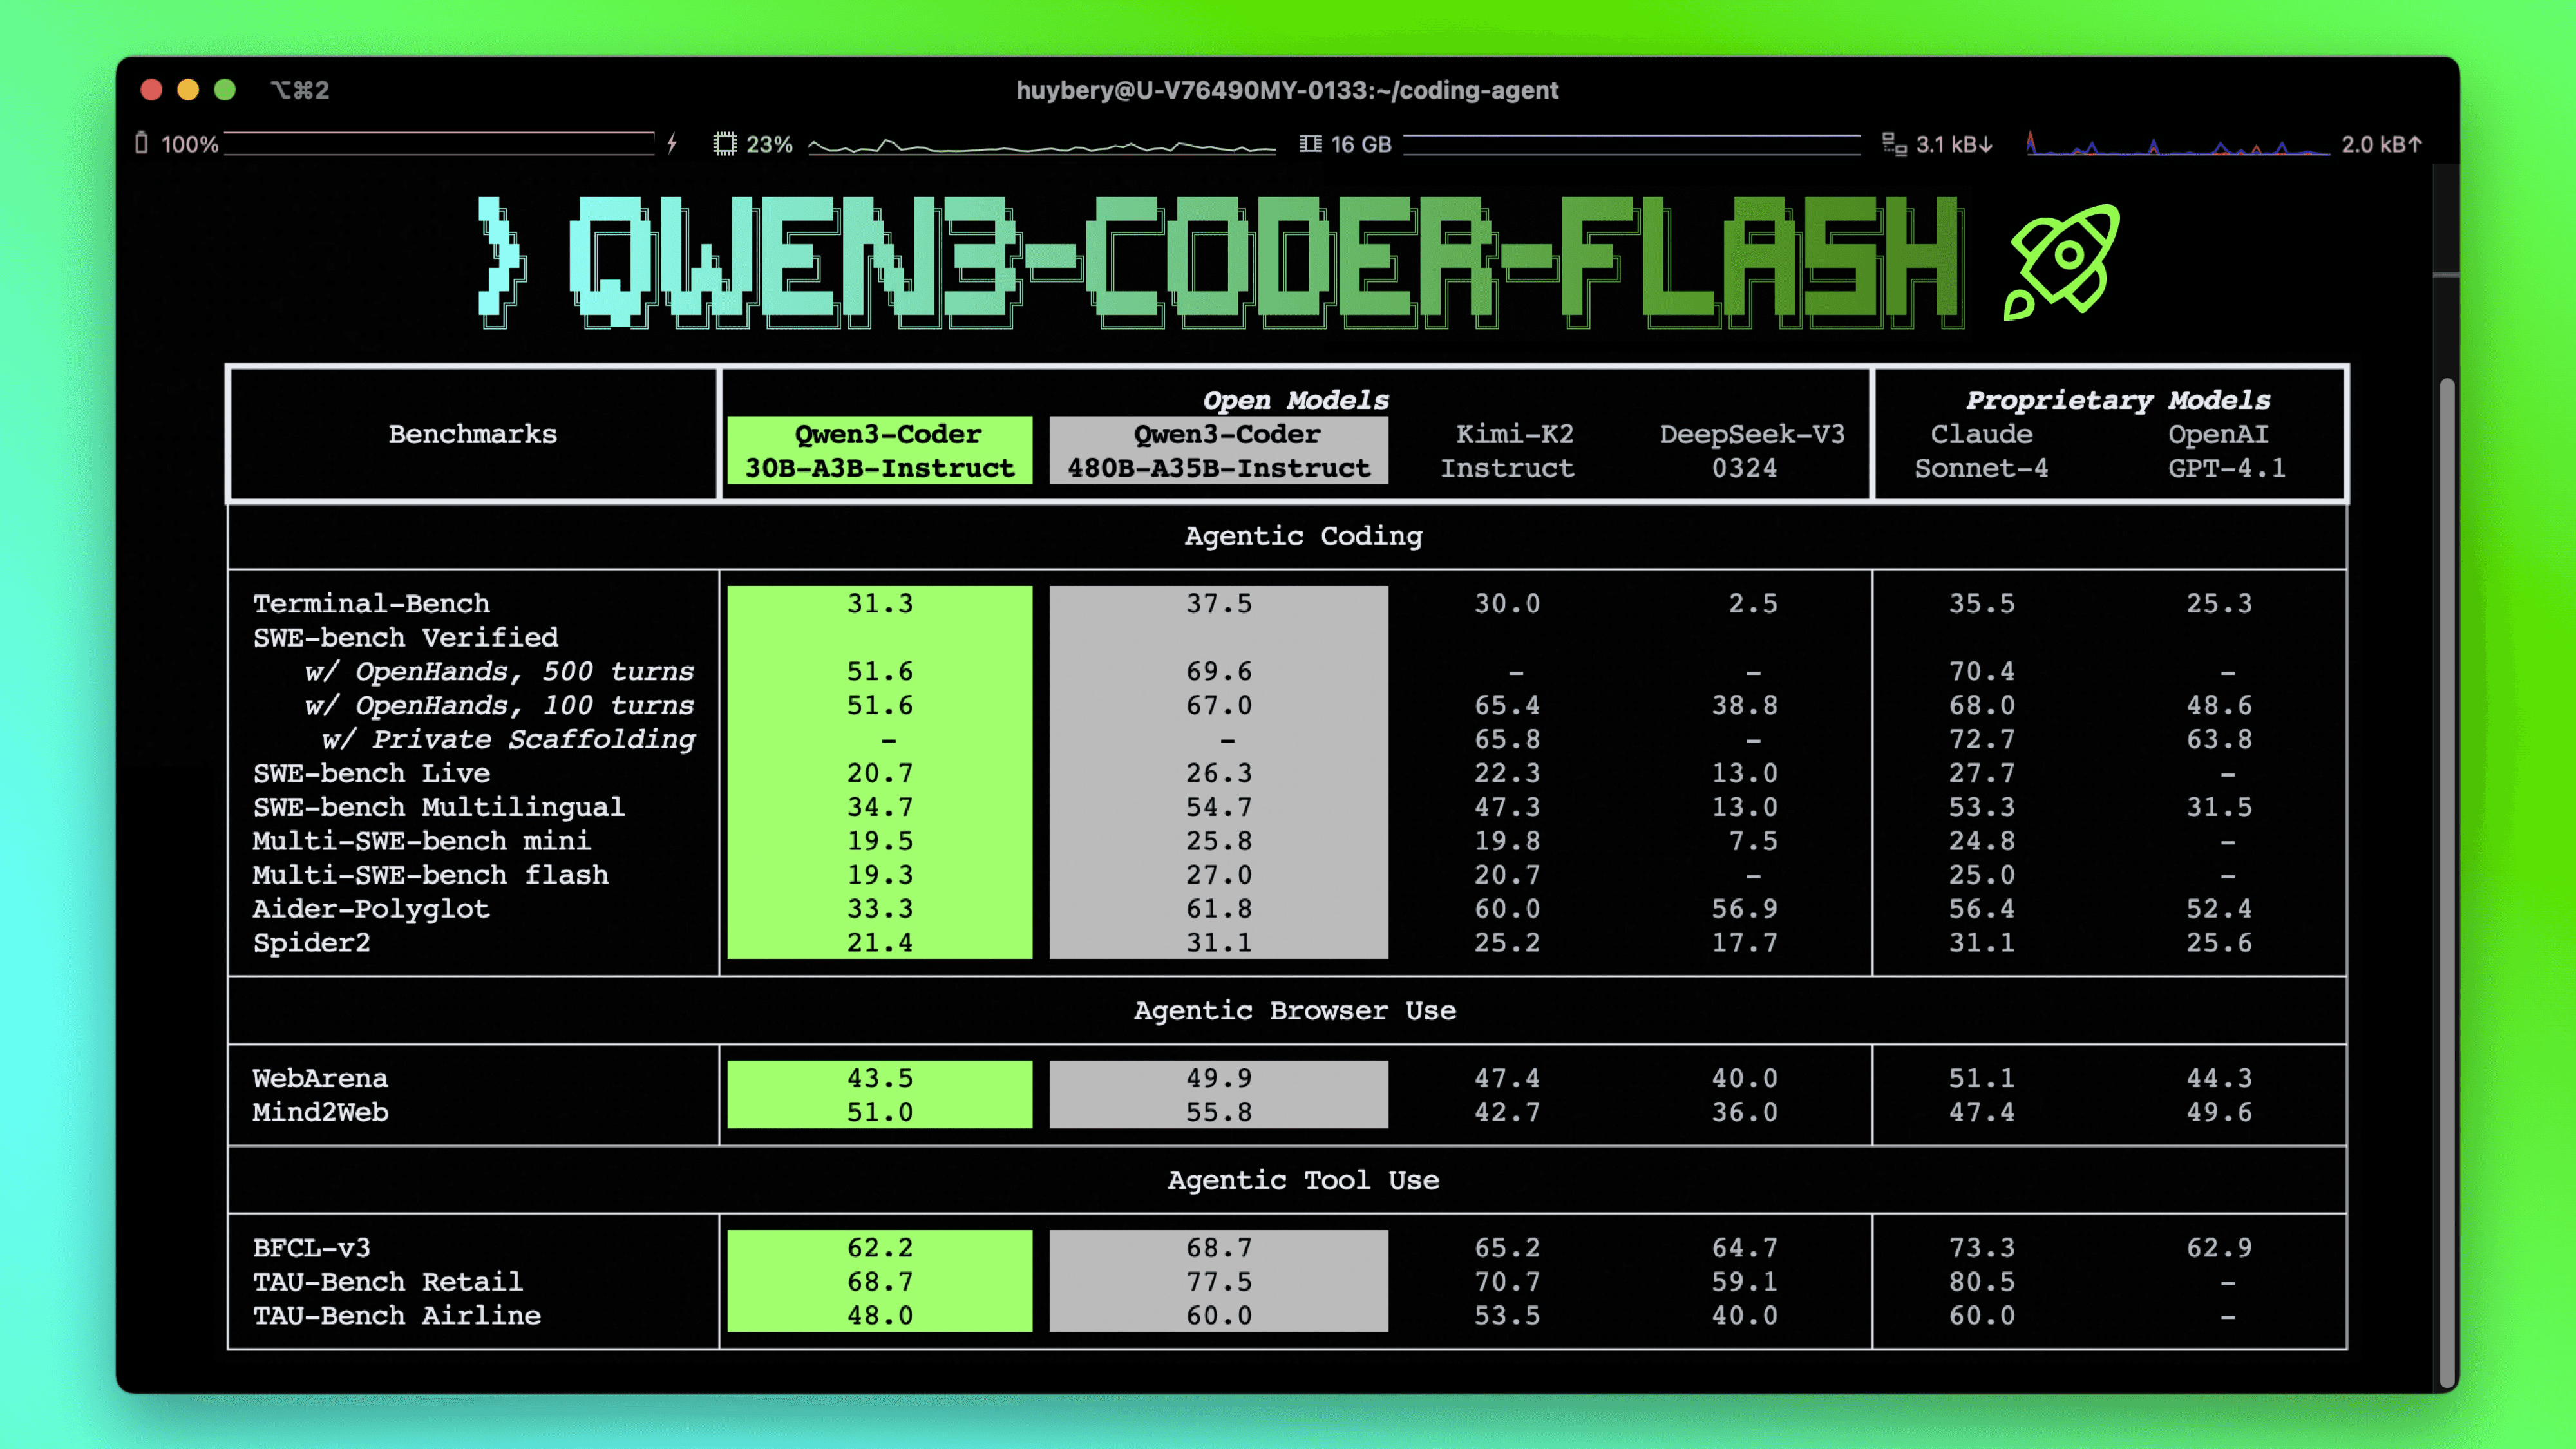
Interestingly, on the Qwen3-Coder-Flash model page, Qwen reports 51.6% on SWE-bench Verified using OpenHands, the same agent framework I am using.
There is also active community discussion about reproducibility for these numbers here. I have not yet found detailed methodology documentation for Qwen3.5's SWE-bench Verified evaluation setup, which may explain part of the discrepancy.
Next Steps / Questions
- Run Qwen3.5-35B-A3B in non-thinking mode.
- Test other Qwen3.5 models.
- Test non-Qwen models.
- Why does BF16 perform worse than the original checkpoint?
- Switch from time-based timeouts (the default in Harbor) to iteration-based limits.
This post contains a broken experiment in which thinking was inadvertently enabled but did not use sampling parameters intended for thinking. See here for a corrected version.
In Part 1 and Part 2, I reported some peculiar behavior for quantized Qwen3.5-2B models:
- KL divergence did not reliably predict downstream coding-agent performance.
- Some quantizations outperformed the original model, while others underperformed.
This post shares early results for a larger variant: Qwen3.5-35B-A3B.
Key Takeaways
vllmcurrently leads this sweep at 46.0% resolved.- Q8_0 and Q5_K_M both outperform the GGUF BF16 variant in resolved rate.
- BF16 and
vllmshow many more timeouts than the quantized GGUF variants. - Public benchmark numbers for this model are meaningfully higher than what I observe locally.
Sweep Summary
| Run | Resolved | % | PPL | KL | Runtime | Exceptions |
|---|---|---|---|---|---|---|
| BF16 | 181/500 | 36.2% | 6.62 | — | 2103m 41s | Timeout(275), ExitCode(17), Reward(3), Verifier(1) |
| Q5_K_M | 194/500 | 38.8% | 6.62 | 0.0083 | 531m 46s | Timeout(8), ExitCode(23), Reward(3), Verifier(1) |
| Q8_0 | 202/500 | 40.4% | 6.61 | 0.0068 | 575m 45s | Timeout(11), ExitCode(24), Reward(1), Verifier(1) |
| vllm | 230/500 | 46.0% | — | — | 1634m 13s | Timeout(145), ExitCode(22), Reward(6) |
Observations
Timeout behavior is a major differentiator
BF16 and vllm both have substantial timeout counts. At this point, it is unclear whether these are true long-horizon failures or loop-like behaviors similar to what I saw with weaker Qwen3.5-2B quantizations. Either way, timeout behavior appears to be a key driver of aggregate score differences.
Behavior differs from Qwen3.5-2B
With Qwen3.5-2B, the smaller GGUF quantizations (Q5_K_M, Q8_0) outperformed both GGUF BF16 and the vllm model. Qwen3.5-35B-A3B shows a similar pattern, but the vllm model outperforms all the GGUF variants.
GGUF BF16 vs original checkpoint is still surprising
There is a notable gap between GGUF BF16 results and the original model results. That is surprising because the original checkpoint is mostly BF16 with a small number of F32 tensors. I checked the GGUF contents and confirmed F32 tensors are present:
vscode ➜ /workspaces/auto-bench (main) $ gguf-dump /home/vscode/.cache/huggingface/hub/models--unsloth--Qwen3.5-35B-A3B-GGUF/snapshots/bc014a17be43adabd7066b7a86075ff935c6a4e2/BF16/Qwen3.5-35B-A3B-BF16-00002-of-00002.gguf | grep "F32" | head -20
INFO:gguf-dump:* Loading: /home/vscode/.cache/huggingface/hub/models--unsloth--Qwen3.5-35B-A3B-GGUF/snapshots/bc014a17be43adabd7066b7a86075ff935c6a4e2/BF16/Qwen3.5-35B-A3B-BF16-00002-of-00002.gguf
    142:       2048 |  2048,     1,     1,     1 | F32     | blk.0.attn_norm.weight
    143:         32 |    32,     1,     1,     1 | F32     | blk.0.ssm_a
    144:      32768 |     4,  8192,     1,     1 | F32     | blk.0.ssm_conv1d.weight
    145:         32 |    32,     1,     1,     1 | F32     | blk.0.ssm_dt.bias
    148:        128 |   128,     1,     1,     1 | F32     | blk.0.ssm_norm.weight
    149:     524288 |  2048,   256,     1,     1 | F32     | blk.0.ffn_gate_inp.weight
    153:       2048 |  2048,     1,     1,     1 | F32     | blk.0.ffn_gate_inp_shexp.weight
    154:       2048 |  2048,     1,     1,     1 | F32     | blk.0.post_attention_norm.weight
    155:       2048 |  2048,     1,     1,     1 | F32     | blk.1.attn_norm.weight
    156:         32 |    32,     1,     1,     1 | F32     | blk.1.ssm_a
    157:      32768 |     4,  8192,     1,     1 | F32     | blk.1.ssm_conv1d.weight
    158:         32 |    32,     1,     1,     1 | F32     | blk.1.ssm_dt.bias
    161:        128 |   128,     1,     1,     1 | F32     | blk.1.ssm_norm.weight
    162:     524288 |  2048,   256,     1,     1 | F32     | blk.1.ffn_gate_inp.weight
    166:       2048 |  2048,     1,     1,     1 | F32     | blk.1.ffn_gate_inp_shexp.weight
    167:       2048 |  2048,     1,     1,     1 | F32     | blk.1.post_attention_norm.weight
    168:       2048 |  2048,     1,     1,     1 | F32     | blk.10.attn_norm.weight
    169:         32 |    32,     1,     1,     1 | F32     | blk.10.ssm_a
    170:      32768 |     4,  8192,     1,     1 | F32     | blk.10.ssm_conv1d.weight
    171:         32 |    32,     1,     1,     1 | F32     | blk.10.ssm_dt.bias
In fact, some tensors appear upcast to F32 in the GGUF file, so raw dtype alone does not explain the performance gap.
Vendor-reported benchmark numbers are much higher
According to Qwen's benchmark page, Qwen3.5-35B-A3B achieves 69.2% on SWE-bench Verified. That is substantially higher than the 46.0% best result in this sweep.
Interestingly, on the Qwen3-Coder-Flash model page, Qwen reports 51.6% on SWE-bench Verified using OpenHands, the same agent framework I am using.
There is also active community discussion about reproducibility for these numbers here. I have not yet found detailed methodology documentation for Qwen3.5's SWE-bench Verified evaluation setup, which may explain part of the discrepancy.
Next Steps
I think the critical question right now is whether the timeouts are legitimate. After reviewing the logs, I think that they may not be. So I'm going to re-run with fewer agents in parallel.
In Part 1, I introduced auto-bench, a tool for benchmarking quantized LLMs for local coding agents, and shared some results from a preliminary study on a single instance from SWE-bench Verified. The results showed that (1) KL Divergence doesn't predict performance, and (2) quantizations can both outperform and underperform the original model.
In this post, I'll share some new results. Like the other experiment, this one
also focuses on Qwen3.5-2B. Unlike the other experiment, which tested a
single instance of SWE-bench Verified with eight
attempts,
this experiment tests all instances of SWE-bench Verified with one
attempt.
Results
Without further ado, here are the results.
| Quant | Resolved | % | PPL | KL | Runtime | Exceptions |
|---|---|---|---|---|---|---|
| BF16 | 28/500 | 5.6% | 13.38 | — | 547m 59s | Timeout(47), ExitCode(22), Verifier(2) |
| IQ4_NL | 26/500 | 5.2% | 13.67 | 0.0309 | 423m 21s | Timeout(29), ExitCode(16), Verifier(1) |
| IQ4_XS | 24/500 | 4.8% | 13.68 | 0.0318 | 493m 7s | Timeout(39), ExitCode(15), Reward(1), Verifier(2) |
| Q3_K_M | 30/500 | 6.0% | 14.33 | 0.0774 | 785m 43s | Timeout(67), ExitCode(21) |
| Q3_K_S | 20/500 | 4.0% | 15.08 | 0.1334 | 742m 25s | Timeout(73), ExitCode(25), Reward(1), Verifier(1) |
| Q4_0 | 24/500 | 4.8% | 13.91 | 0.0454 | 407m 34s | Timeout(25), ExitCode(21), Verifier(1) |
| Q4_1 | 36/500 | 7.2% | 13.68 | 0.0273 | 766m 19s | Timeout(59), ExitCode(16), Reward(1), Verifier(1) |
| Q4_K_M | 27/500 | 5.4% | 13.79 | 0.0230 | 357m 0s | Timeout(20), ExitCode(23), Verifier(2) |
| Q4_K_S | 19/500 | 3.8% | 13.78 | 0.0274 | 519m 39s | Timeout(38), ExitCode(23), Reward(1), Verifier(1) |
| Q5_K_M | 62/500 | 12.4% | 13.46 | 0.0082 | 784m 58s | Timeout(61), ExitCode(23), Reward(1), Verifier(1) |
| Q5_K_S | 46/500 | 9.2% | 13.49 | 0.0100 | 563m 27s | Timeout(30), ExitCode(25), Reward(1), Verifier(3) |
| Q6_K | 58/500 | 11.6% | 13.48 | 0.0035 | 820m 37s | Timeout(62), ExitCode(20), Verifier(1) |
| Q8_0 | 37/500 | 7.4% | 13.39 | 0.0012 | 598m 13s | Timeout(46), ExitCode(17), Verifier(1) |
| UD-IQ2_M | 1/500 | 0.2% | 17.61 | 0.2677 | 1866m 13s | Timeout(300), ExitCode(24), Verifier(1) |
| UD-IQ2_XXS | 1/500 | 0.2% | 27.11 | 0.7018 | 2196m 49s | Timeout(371), ExitCode(19) |
| UD-IQ3_XXS | 5/500 | 1.0% | 15.31 | 0.1549 | 1481m 24s | Timeout(230), ExitCode(24), Verifier(1) |
| UD-Q2_K_XL | 2/500 | 0.4% | 17.15 | 0.2388 | 442m 51s | Timeout(29), ExitCode(27) |
| UD-Q3_K_XL | 48/500 | 9.6% | 13.94 | 0.0520 | 738m 44s | Timeout(57), ExitCode(19), Reward(1), Verifier(1) |
| UD-Q4_K_XL | 57/500 | 11.4% | 13.60 | 0.0164 | 759m 13s | Timeout(48), ExitCode(18), Reward(2), Verifier(2) |
| UD-Q5_K_XL | 62/500 | 12.4% | 13.51 | 0.0077 | 932m 37s | Timeout(71), ExitCode(18), Reward(2), Verifier(1) |
| UD-Q6_K_XL | 29/500 | 5.8% | 13.48 | 0.0020 | 539m 38s | Timeout(35), ExitCode(20), Verifier(1) |
| UD-Q8_K_XL | 36/500 | 7.2% | 13.37 | 0.0011 | 502m 1s | Setup(1), Timeout(35), ExitCode(23), Verifier(2) |
| vllm | 26/500 | 5.2% | — | — | 521m 14s | Timeout(49), ExitCode(11), Verifier(1) |
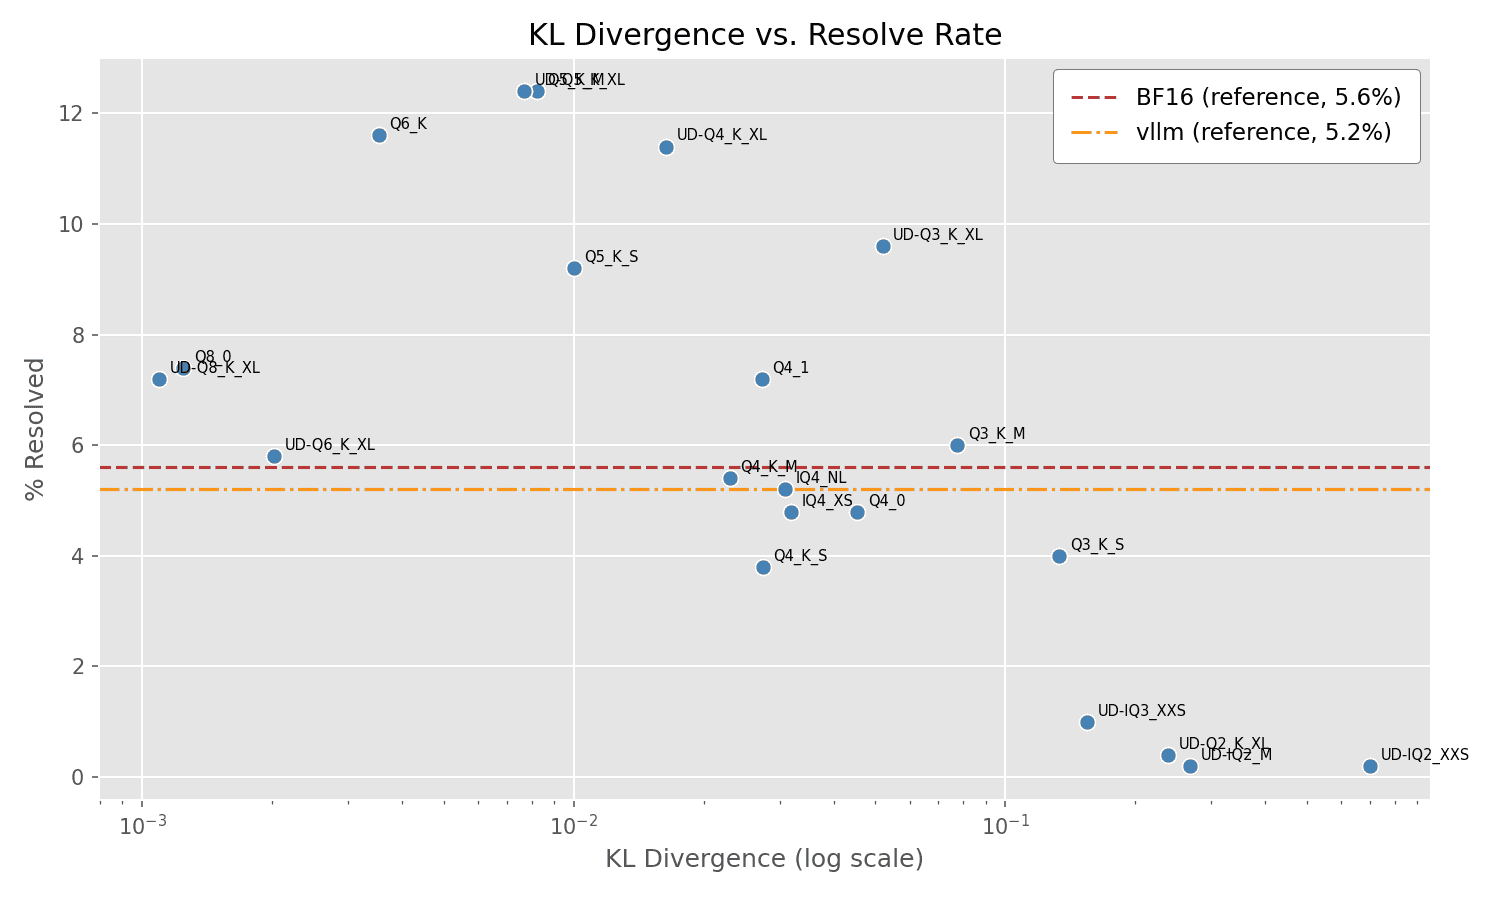
And the plot of % Resolved vs KL Divergence:
Observations
A few observations:
- The overall resolve rates are low across the board. This is not a very powerful model. I intentionally selected an easy problem instance for the Part 1 experiment.
- As in Part 1, many of the "mid-range" quantizations outperform the original model, yet small and large quantizations underperform. This is consistent with the idea that some quantizations are actually beneficial, while others are harmful.
- Also as in Part 1, KL Divergence does not fully explain performance.
What next?
This experiment largely confirmed the findings from Part 1 about the Qwen3.5-2B model. An open question is whether these results apply to other models as well. I plan to run similar experiments on larger variants of the Qwen3.5 family next, but I won't be evaluating every quantization. Too much time is wasted on bad quantizations because they get stuck in endless loops. Instead, I'll probably try a select few quantizations, such as BF16, Q8_0, and Q5_K_M. Although I am interested in understanding these peculiar behaviors, my primary goal is actually to find which models and quantizations are usable.
OOAnalyzer is one of my favorite projects for a few reasons. The underlying problem is deceptively hard. If you look closely enough, OO executables have a lot of evidence in them. When you consider each piece in isolation, it can seem simple. But when you try to combine all of the evidence, you wind up with a combinatorial explosion of possibilities that is pruned by constraints in very complex ways. I also like it because it's a very practical problem. People actually use OOAnalyzer, despite all of its limitations—a testament to how even flawed solutions to hard problems can be valuable.
OOAnalyzer is a successor to an earlier project that predated me at SEI called ObjDigger. OOAnalyzer's big innovation was to use what we called "hypothetical reasoning" about ambiguous scenarios. In a nutshell, we often faced a choice between several possibilities. For example, class D inherits from class B, and we see class M in class D's vftable. We know that M is either a method of D or a method of B. We can't tell which one it is, but we can make a guess, and see if that leads to a contradiction. If it does, then we know our guess was wrong, and we can eliminate that possibility and try the others. This is a powerful technique that was partially enabled by our use of Prolog in OOAnalyzer, specifically Prolog's backtracking search.
That being said, OOAnalyzer's hypothetical reasoning is not perfect. One problem we encountered while developing OOAnalyzer was that there could be a long gap between a guess and when the contradiction is detected. Let's say we make a guess that eventually will cause a contradiction, but we must make 10 other boolean guesses before detecting the contradiction. At that point, Prolog would backtrack the guesses, starting with the most recent guess. Unfortunately, Prolog has no way of knowing that the actual cause was much further back, and it would waste time re-exploring models that were doomed to fail. Over time, we began to shape the rules in OOAnalyzer to avoid this problem. We ordered the rules so that any guess likely to lead to a contradiction would be detected immediately. This worked, but also limited our reasoning power.
Another problem with OOAnalyzer is how it decides on a final model. The final model is simply the first one that allows all guesses (uncertainties) to be resolved and does not lead to a contradiction. OOAnalyzer's guessing rules are ordered so that the more important ones are made earlier, when they have less chance of conflicting with a previous decision. But there is no guarantee that this model is the best one, or even close to it! Over time, I formed the opinion that OOAnalyzer is really an optimization problem. Our rules permit multiple models that could explain the evidence. But some are better than others. For example, many OO programs without vftables and vbtables can be explained by a model with no OO classes or methods. This is valid, but not very useful for the analyst.
Finally, OOAnalyzer involves a lot of constraints. For example, we might know that a method is either a constructor, real destructor, or deleting destructor. Obviously if we learn that the same method is not a destructor, it must be a constructor. Because we didn't use constraints in OOAnalyzer, we had to implement this type of logic manually. It works, but it's not elegant.
Over time, I've wondered how to better frame the OOAnalyzer problem, and recently I started exploring Answer Set Programming (ASP) as a potential answer. ASP is a form of declarative programming that is based on the stable model semantics of logic programming. It is designed to solve combinatorial search problems, and it has built-in support for constraints and optimization. ASP has several key features:
- It allows for declarative rules, like Prolog.
- It has built-in support for constraints.
1 { constructor(X); real_destructor(X); deleting_destructor(X) } 1means that exactly one of the three predicates must be true for any given X. - It has built-in support for optimization. We can assign weights to different models and ask the solver to find the global optimum, or the best solution found within a time limit.
In my spare time, I've been porting parts of OOAnalyzer to ASP here. I've been pleasantly surprised by how well it has worked so far. The code is much more concise and easier to read than the Prolog version. The constraints are much easier to express. For example, here's a rule that says if we see certain behavior (like installing vftables), we know that the method is a constructor or destructor:
% A method that writes a vftable/vbtable into its own this-pointer must be
% exactly one of: constructor, real destructor, or deleting destructor.
% Covers:
%   reasonConstructor (rules.pl:192) — elimination: only remaining candidate
%   reasonRealDestructor (rules.pl:388) — elimination: only remaining candidate
%   reasonDeletingDestructor (rules.pl:575) — elimination: only remaining candidate
%!trace_rule {"% is exactly one of constructor, real destructor, or deleting destructor", Method}
1 { constructor(Method) ; realDestructor(Method) ; deletingDestructor(Method) } 1 :-
    certainConstructorOrDestructor(Method).
Similarly, here's a rule saying that a method can only be one of a constructor, real destructor, or deleting destructor:
constructorDestructorKind(Method, constructor) :-
    constructor(Method).
constructorDestructorKind(Method, realDestructor) :-
    realDestructor(Method).
constructorDestructorKind(Method, deletingDestructor) :-
    deletingDestructor(Method).

% Covers:
%   insanityConstructorAndRealDestructor (insanity.pl:226)
%   insanityConstructorAndDeletingDestructor (insanity.pl:240)
%   reasonNOTConstructor_B (rules.pl:281) — realDestructor → notConstructor
%   reasonNOTConstructor_C (rules.pl:288) — deletingDestructor → notConstructor
%   reasonNOTRealDestructor_B (rules.pl:443) — constructor → notRealDestructor
%   reasonNOTRealDestructor_C (rules.pl:448) — deletingDestructor → notRealDestructor
%   reasonNOTDeletingDestructor_B (rules.pl:632) — constructor → notDeletingDestructor
%   reasonNOTDeletingDestructor_C (rules.pl:637) — realDestructor → notDeletingDestructor
%!trace_rule {"% has multiple constructor/destructor kinds", Method}
insanity(insanityMultipleConstructorDestructorKinds, (Method,Count)) :-
    method(Method),
    Count = #count { Kind : constructorDestructorKind(Method, Kind) },
    Count > 1.
As the comment above says, this rule covers about 8 different rules in OOAnalyzer. In ASP, we can express the same thing much more concisely.
OOAnalyzer-ASP can already read OOAnalyzer's facts format. You can see some examples of the results in the repository. Bear in mind that not all rules are ported yet.
One last thing I'll share is automatic explanations of models. I've been using the xclingo2 library to generate explanations for the ASP models. Even as OOAnalyzer's developer, it can be hard to understand how it reasons, because it could involve dozens of related conclusions. This is exacerbated in ASP because constraints and the optimization criteria are "silent". But even so, xclingo2 can generate detailed proof trees showing why a particular atom was included in the model. Here's an example of a proof tree for why a method is a constructor:
  |__4266400 is a constructor
  |  |__4266400 is a method;4266400 is a method because 4266176 calls it at this-offset 0
  |  |  |__thunk 4264566 resolves to 4266400
  |  |  |  |__thunk 4266400 resolves to 4266400
  |  |  |__4266176 is a method;4266176 is a method because it is a known constructor
  |  |  |  |__4266176 is a constructor;4266176 is exactly one of constructor, real destructor, or deleting destructor
  |  |  |  |  |__4266176 must be a constructor or destructor because it writes a vftable into its own this-pointer
  |  |  |  |  |  |__4266176 writes confirmed vftable 4290632 at offset 0
  |  |  |  |  |  |  |__4290632 is a confirmed vftable;4290632 is a confirmed vftable because RTTI says so
So is this the next generation OOAnalyzer? Theoretically, I think the answer is yes! But practically, it's unclear how well this is going to scale to real programs. One of the downsides to most ASP implementations is that they ground eagerly. Because executables can have a lot of evidence, it's possible this can lead to a combinatorial explosion in the number of ground rules. Because OOAnalyzer's rules involve negation and recursion in complex ways, it's hard to say how much of an issue this will be. We're able to find the optimal model on all of the toy OOAnalyzer programs, but that doesn't mean much. There are alternative approaches to ASP, like lazy grounding, but they are less mature. I'm hopeful that with cautious engineering, we can make this work on real programs, but only time will tell. In the meantime, I'm having fun exploring this new approach to the problem!
Powered with by Gatsby 5.0