
In Part 1 and Part 2, I reported some peculiar behavior for quantized Qwen3.5-2B models. In Part 3, I reported results for a larger variant, Qwen3.5-35B-A3B, with thinking enabled.
In this post, we'll take a look at performance with thinking enabled vs. disabled.
Sweep Summary
| Run | Resolved | % | PPL | KL | Runtime | Exceptions |
|---|---|---|---|---|---|---|
| thinking-BF16 | 173/500 | 34.6% | 6.62 | — | 1392m 16s | Timeout(15), ExitCode(22), Reward(2), Verifier(1) |
| thinking-Q5_K_M | 180/500 | 36.0% | 6.62 | 0.0083 | 1046m 35s | Timeout(8), ExitCode(19), Reward(5) |
| thinking-Q8_0 | 193/500 | 38.6% | 6.61 | 0.0068 | 1646m 39s | Setup(7), Timeout(12), ExitCode(18), Reward(4), Verifier(1) |
| thinking-vllm | 233/500 | 46.6% | — | — | 1753m 3s | Timeout(41), NetworkConnectionError(1), ExitCode(28), Reward(3), Verifier(1) |
| nonthinking-BF16 | 273/500 | 54.6% | 6.62 | -0.0000 | 1104m 26s | Timeout(1), ExitCode(22), Reward(2), Verifier(1) |
| nonthinking-Q8_0 | 260/500 | 52.0% | 6.61 | 0.0068 | 890m 2s | Timeout(2), ExitCode(18), Reward(2), Verifier(1) |
| nonthinking-Q5_K_M | 263/500 | 52.6% | 6.62 | 0.0083 | 877m 18s | Timeout(2), ExitCode(23), Reward(6), Verifier(1) |
| nonthinking-vllm | 269/500 | 53.8% | — | — | 734m 0s | Timeout(4), ExitCode(33), Reward(1), Verifier(1) |
Analysis
As expected, the thinking runs took longer to complete than the non-thinking runs. But unexpectedly, non-thinking runs outperformed thinking runs across the board. This is counterintuitive, since we would expect that thinking would improve performance. That is how it's supposed to work!
One concern I had with this experiment was whether timeouts were affecting the results, that is, if given enough time, the thinking runs would eventually outperform the non-thinking runs. I actually ended up running this several times, eventually with quite long timeouts. Most of the remaining timeouts were due to thinking loops rather than legitimate reasoning timeouts. So endless loops are a concern with this particular model on thinking runs. But we see more differences in performance --- exactly 100 more problems were resolved by nonthinking-BF16 than thinking-BF16 --- that can't be explained by the 15 observed timeouts in the thinking-BF16 run.
I asked AI to analyze the results and it found two problems.
Problem 1: Tool-call parsing
In thinking mode, llama.cpp is experiencing a malformed tool-call parse crash that is causing a large number of failures. These failures cause openhands to exit.
I can trigger this behavior using this script:
=== firing the same clean real prompt 10 times ===
POST http://172.17.0.2:8085/v1/chat/completions x 10

  probe 1: EXTRACTED (str_replace_editor)
  probe 2: EXTRACTED (str_replace_editor)
  probe 3: EMPTY (finish_reason=stop, no content, no reasoning)
  probe 4: EMPTY (finish_reason=stop, no content, no reasoning)
  probe 5: CRASH (500: Failed to parse input at pos 49: <tool_call>
<function=str_replace_editor>
<parameter=command>
view
)
  probe 6: EMPTY (finish_reason=stop, no content, no reasoning)
  probe 7: EMPTY (finish_reason=stop, no content, no reasoning)
  probe 8: CRASH (500: Failed to parse input at pos 49: <tool_call>
<function=str_replace_editor>
<parameter=command>
view
)
  probe 9: EMPTY (finish_reason=stop, no content, no reasoning)
  probe 10: EMPTY (finish_reason=stop, no content, no reasoning)

  -> extracted: 2/10, stuck: 0/10, crash: 2/10, empty: 6/10, other: 0/10
So out of 10 queries, we get the failure to parse twice, and then an empty response 6 times. Something is clearly going wrong!
With the help of AI, I was able to attribute many of the problems to a grammar
problem. The model often emits a redundant <thinking> tag, which causes
llama.cpp's parser to fail. As you can see in this AI-generated table, this
happens very frequently:
| Model | Resolved | Harbor exception¹ | Parse-crash² | Stuck-loop³ | Other silent-crash⁴ | Unexplained⁵ |
|---|---|---|---|---|---|---|
| BF16 | 173 | 35 | 144 | 85 | 1 | 62 |
| Q8_0 | 193 | 39 | 99 | 107 | 1 | 61 |
| Q5_K_M | 180 | 31 | 96 | 135 | 3 | 55 |
| vLLM | 233 | 65 | 0 | 91 | 13 | 98 |
¹ Timeout/ExitCode/Setup/Reward/Verifier/NetworkConnectionError — the only category Harbor's own exit-code-based detection actually catches.
² llama.cpp's PEG parser crash (Failed to parse input at pos N), trial ended fatally right there. Zero on vLLM.
³ OpenHands' AgentStuckInLoopError killed the attempt.
⁴ Other unrelated fatal errors (mostly the chardet/action-execution-server bug on vLLM).
⁵ Attempts that neither resolved, hit a Harbor exception, nor showed any of the fatal patterns checked — genuinely completed but produced a wrong patch, or a crash pattern not yet characterized.
Problem 2: Harbor error handling
The second problem is that Harbor does not detect the error. And it seems that this is because openhands returns exit code 0.
What a mess!
Concluding Thoughts
We can't detect the redundant <thinking> tag problem in vllm, but it could
still be happening (update: it is happening). vllm has a different tool parsing
mechanism than llama.cpp; it might be more forgiving (update: it is). For
whatever reason, vllm-thinking is still underperforming vllm-nonthinking.
According to Qwen's blog post, Qwen3.5-35B-A3B scores 70.0% on SWE-bench Verified. There is a small footnote too:
SWE-Bench Series: Internal agent scaffold (bash + file-edit tools); temp=1.0, top_p=0.95, 200K context window. We correct some problematic tasks in the public set of SWE-bench Pro and evaluate all baselines on the refined benchmark.
I'm not going to comment on the "correct some problematic tasks" part.
That temperature of 1.0 and top_p of 0.95 are recommended by Qwen for both thinking "general tasks" (as opposed to "precise coding tasks") and non-thinking "reasoning tasks" (as opposed to "general tasks"). Unfortunately, as you can see here, for these results I used "precise coding tasks" and "general tasks", which both use different temperature and top_p settings. If you are wondering why SWE-Bench Verified is not considered a "precise coding task"... well, so am I. Ask Qwen! IMHO, models should have a single set of recommended parameters for all tasks, and the model should be able to handle the task type automatically.
Next Steps
-
I am going to try to confirm whether the redundant
<thinking>tag is generated by vllm-thinking. If it is, then it suggests that the model is buggy. Which would be weird --- the model defaults to thinking. (Update: I confirmed that vllm-thinking does generate the redundant<thinking>tag, so its parser must be more forgiving than llama.cpp's parser.) -
I am going to rerun the experiments with all four parameter settings that Qwen recommends, since I apparently chose different ones than Qwen did when they tested SWE-Bench Verified.
-
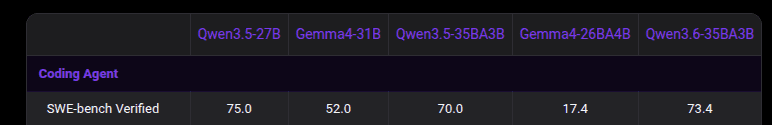
I'm will test the dense model Qwen3.5-27B.
-
I am also going to investigate agents other than openhands. I originally selected openhands because it is the first agent I was able to get to work with Harbor. But at the time, Harbor was only compatible with an older branch of openhands. Hopefully this has changed, or a more reasonable harness like opencode will work now.
In Part 1 and Part 2, I reported some peculiar behavior for quantized Qwen3.5-2B models. In Part 3 Take 1, I reported early results for a larger variant: Qwen3.5-35B-A3B. But I recently discovered that this experiment had a problem that may have been contributing to Timeouts.
The Issue
Qwen3.5 can be used in either "thinking" or "non-thinking" mode. Small models like Qwen3.5-2B default to non-thinking mode, but larger models like Qwen3.5-35B default to thinking mode. When I switched to testing Qwen3.5-35B-A3B, I did not realize that the default mode had changed. That's the first problem; we were testing Qwen3.5-2B without thinking against Qwen3.5-35B-A3B with thinking. The second problem is that Qwen recommends different sampling parameters for thinking vs. non-thinking mode. So we were using a non-thinking sampling configuration with a thinking model. This is likely to have contributed to the Timeouts we observed in Take 1. Manual analysis revealed that many of these cases were indeed thinking loops, which is consistent with the fact that we were using an invalid sampling configuration with a thinking model.
So, mea culpa. Fortunately, I noticed this problem because I wondered why vllm had so many Timeouts and investigated further. I think this is a good example of why we need to conduct and automate these experiments. It's easy to make mistakes when running these experiments manually, and automation can help catch these issues, or at least make sure we don't repeat them once we noticed the problem. And even if you aren't running experiments, it's easy to accidentally use a model with unsupported parameters and get poor results. So it's important to understand the model and make sure you are running with all of the correct parameters.
Take Two
So let's try this again but explicitly set the model to thinking mode and use the recommended sampling parameters for thinking. Recall that we were attempting to see whether the trends we observed for Qwen3.5-2B would hold for Qwen3.5-35B-A3B:
- KL divergence did not reliably predict downstream coding-agent performance.
- Some quantizations outperformed the original model, while others underperformed.
Old, Invalid Results
Here was the old, invalid run summary from Take 1:
| Run | Resolved | % | PPL | KL | Runtime | Exceptions |
|---|---|---|---|---|---|---|
| BF16 | 181/500 | 36.2% | 6.62 | — | 2103m 41s | Timeout(275), ExitCode(17), Reward(3), Verifier(1) |
| Q5_K_M | 194/500 | 38.8% | 6.62 | 0.0083 | 531m 46s | Timeout(8), ExitCode(23), Reward(3), Verifier(1) |
| Q8_0 | 202/500 | 40.4% | 6.61 | 0.0068 | 575m 45s | Timeout(11), ExitCode(24), Reward(1), Verifier(1) |
| vllm | 230/500 | 46.0% | — | — | 1634m 13s | Timeout(145), ExitCode(22), Reward(6) |
And here were the key takeaways from Take 1:
vllmcurrently leads this sweep at 46.0% resolved.- Q8_0 and Q5_K_M both outperform the GGUF BF16 variant in resolved rate.
- BF16 and
vllmshow many more timeouts than the quantized GGUF variants. - Public benchmark numbers for this model are meaningfully higher than what I observe locally.
New, Corrected Results
Let's look at the corrected (hopefully) results from Take 2. Here is the new run summary:
| Run | Resolved | % | PPL | KL | Runtime | Exceptions |
|---|---|---|---|---|---|---|
| BF16 | 174/500 | 34.8% | 6.62 | — | 1451m 33s | AddTestsDirError(1), Timeout(24), ExitCode(20), Reward(2) |
| Q5_K_M | 187/500 | 37.4% | 6.62 | 0.0083 | 978m 48s | Timeout(11), ExitCode(19), Reward(1), Verifier(1) |
| Q8_0 | 181/500 | 36.2% | 6.61 | 0.0068 | 989m 28s | Timeout(7), ExitCode(24), Reward(1) |
| vllm | 249/500 | 49.8% | — | — | 1605m 47s | Timeout(42), ExitCode(19), Reward(5), Verifier(2) |
New takeaways:
vllmstill leads this sweep at 49.8% resolved.- Q5_K_M and Q8_0 still outperform the GGUF BF16 variant in resolved rate.
- BF16 and
vllmstill show more timeouts than the quantized GGUF variants, but the gap is much smaller than in Take 1. Manual analysis showed that the models were still making progress rather than being stuck in loops. - Public benchmark numbers for this model are meaningfully higher than what I observe locally.
If you look closely, the takeaways are essentially the same. Oddly enough,
vllm improved its performance with the correct configuration, while the GGUF
variants all performed worse.
Observations
Behavior differs from Qwen3.5-2B
With Qwen3.5-2B, the smaller GGUF quantizations (Q5_K_M, Q8_0) outperformed both GGUF BF16 and the vllm model. Qwen3.5-35B-A3B shows a similar pattern, but the vllm model outperforms all the GGUF variants.
GGUF BF16 vs original checkpoint is still surprising
There is a notable gap between GGUF BF16 results and the original model results. That is surprising because the original checkpoint is mostly BF16 with a small number of F32 tensors. I checked the GGUF contents and confirmed F32 tensors are present:
vscode ➜ /workspaces/auto-bench (main) $ gguf-dump /home/vscode/.cache/huggingface/hub/models--unsloth--Qwen3.5-35B-A3B-GGUF/snapshots/bc014a17be43adabd7066b7a86075ff935c6a4e2/BF16/Qwen3.5-35B-A3B-BF16-00002-of-00002.gguf | grep "F32" | head -20
INFO:gguf-dump:* Loading: /home/vscode/.cache/huggingface/hub/models--unsloth--Qwen3.5-35B-A3B-GGUF/snapshots/bc014a17be43adabd7066b7a86075ff935c6a4e2/BF16/Qwen3.5-35B-A3B-BF16-00002-of-00002.gguf
    142:       2048 |  2048,     1,     1,     1 | F32     | blk.0.attn_norm.weight
    143:         32 |    32,     1,     1,     1 | F32     | blk.0.ssm_a
    144:      32768 |     4,  8192,     1,     1 | F32     | blk.0.ssm_conv1d.weight
    145:         32 |    32,     1,     1,     1 | F32     | blk.0.ssm_dt.bias
    148:        128 |   128,     1,     1,     1 | F32     | blk.0.ssm_norm.weight
    149:     524288 |  2048,   256,     1,     1 | F32     | blk.0.ffn_gate_inp.weight
    153:       2048 |  2048,     1,     1,     1 | F32     | blk.0.ffn_gate_inp_shexp.weight
    154:       2048 |  2048,     1,     1,     1 | F32     | blk.0.post_attention_norm.weight
    155:       2048 |  2048,     1,     1,     1 | F32     | blk.1.attn_norm.weight
    156:         32 |    32,     1,     1,     1 | F32     | blk.1.ssm_a
    157:      32768 |     4,  8192,     1,     1 | F32     | blk.1.ssm_conv1d.weight
    158:         32 |    32,     1,     1,     1 | F32     | blk.1.ssm_dt.bias
    161:        128 |   128,     1,     1,     1 | F32     | blk.1.ssm_norm.weight
    162:     524288 |  2048,   256,     1,     1 | F32     | blk.1.ffn_gate_inp.weight
    166:       2048 |  2048,     1,     1,     1 | F32     | blk.1.ffn_gate_inp_shexp.weight
    167:       2048 |  2048,     1,     1,     1 | F32     | blk.1.post_attention_norm.weight
    168:       2048 |  2048,     1,     1,     1 | F32     | blk.10.attn_norm.weight
    169:         32 |    32,     1,     1,     1 | F32     | blk.10.ssm_a
    170:      32768 |     4,  8192,     1,     1 | F32     | blk.10.ssm_conv1d.weight
    171:         32 |    32,     1,     1,     1 | F32     | blk.10.ssm_dt.bias
In fact, some tensors appear upcast to F32 in the GGUF file, so raw dtype alone does not explain the performance gap.
Vendor-reported benchmark numbers are much higher
According to Qwen's benchmark page, Qwen3.5-35B-A3B achieves 69.2% on SWE-bench Verified. That is substantially higher than the 49.8% best result in this sweep.
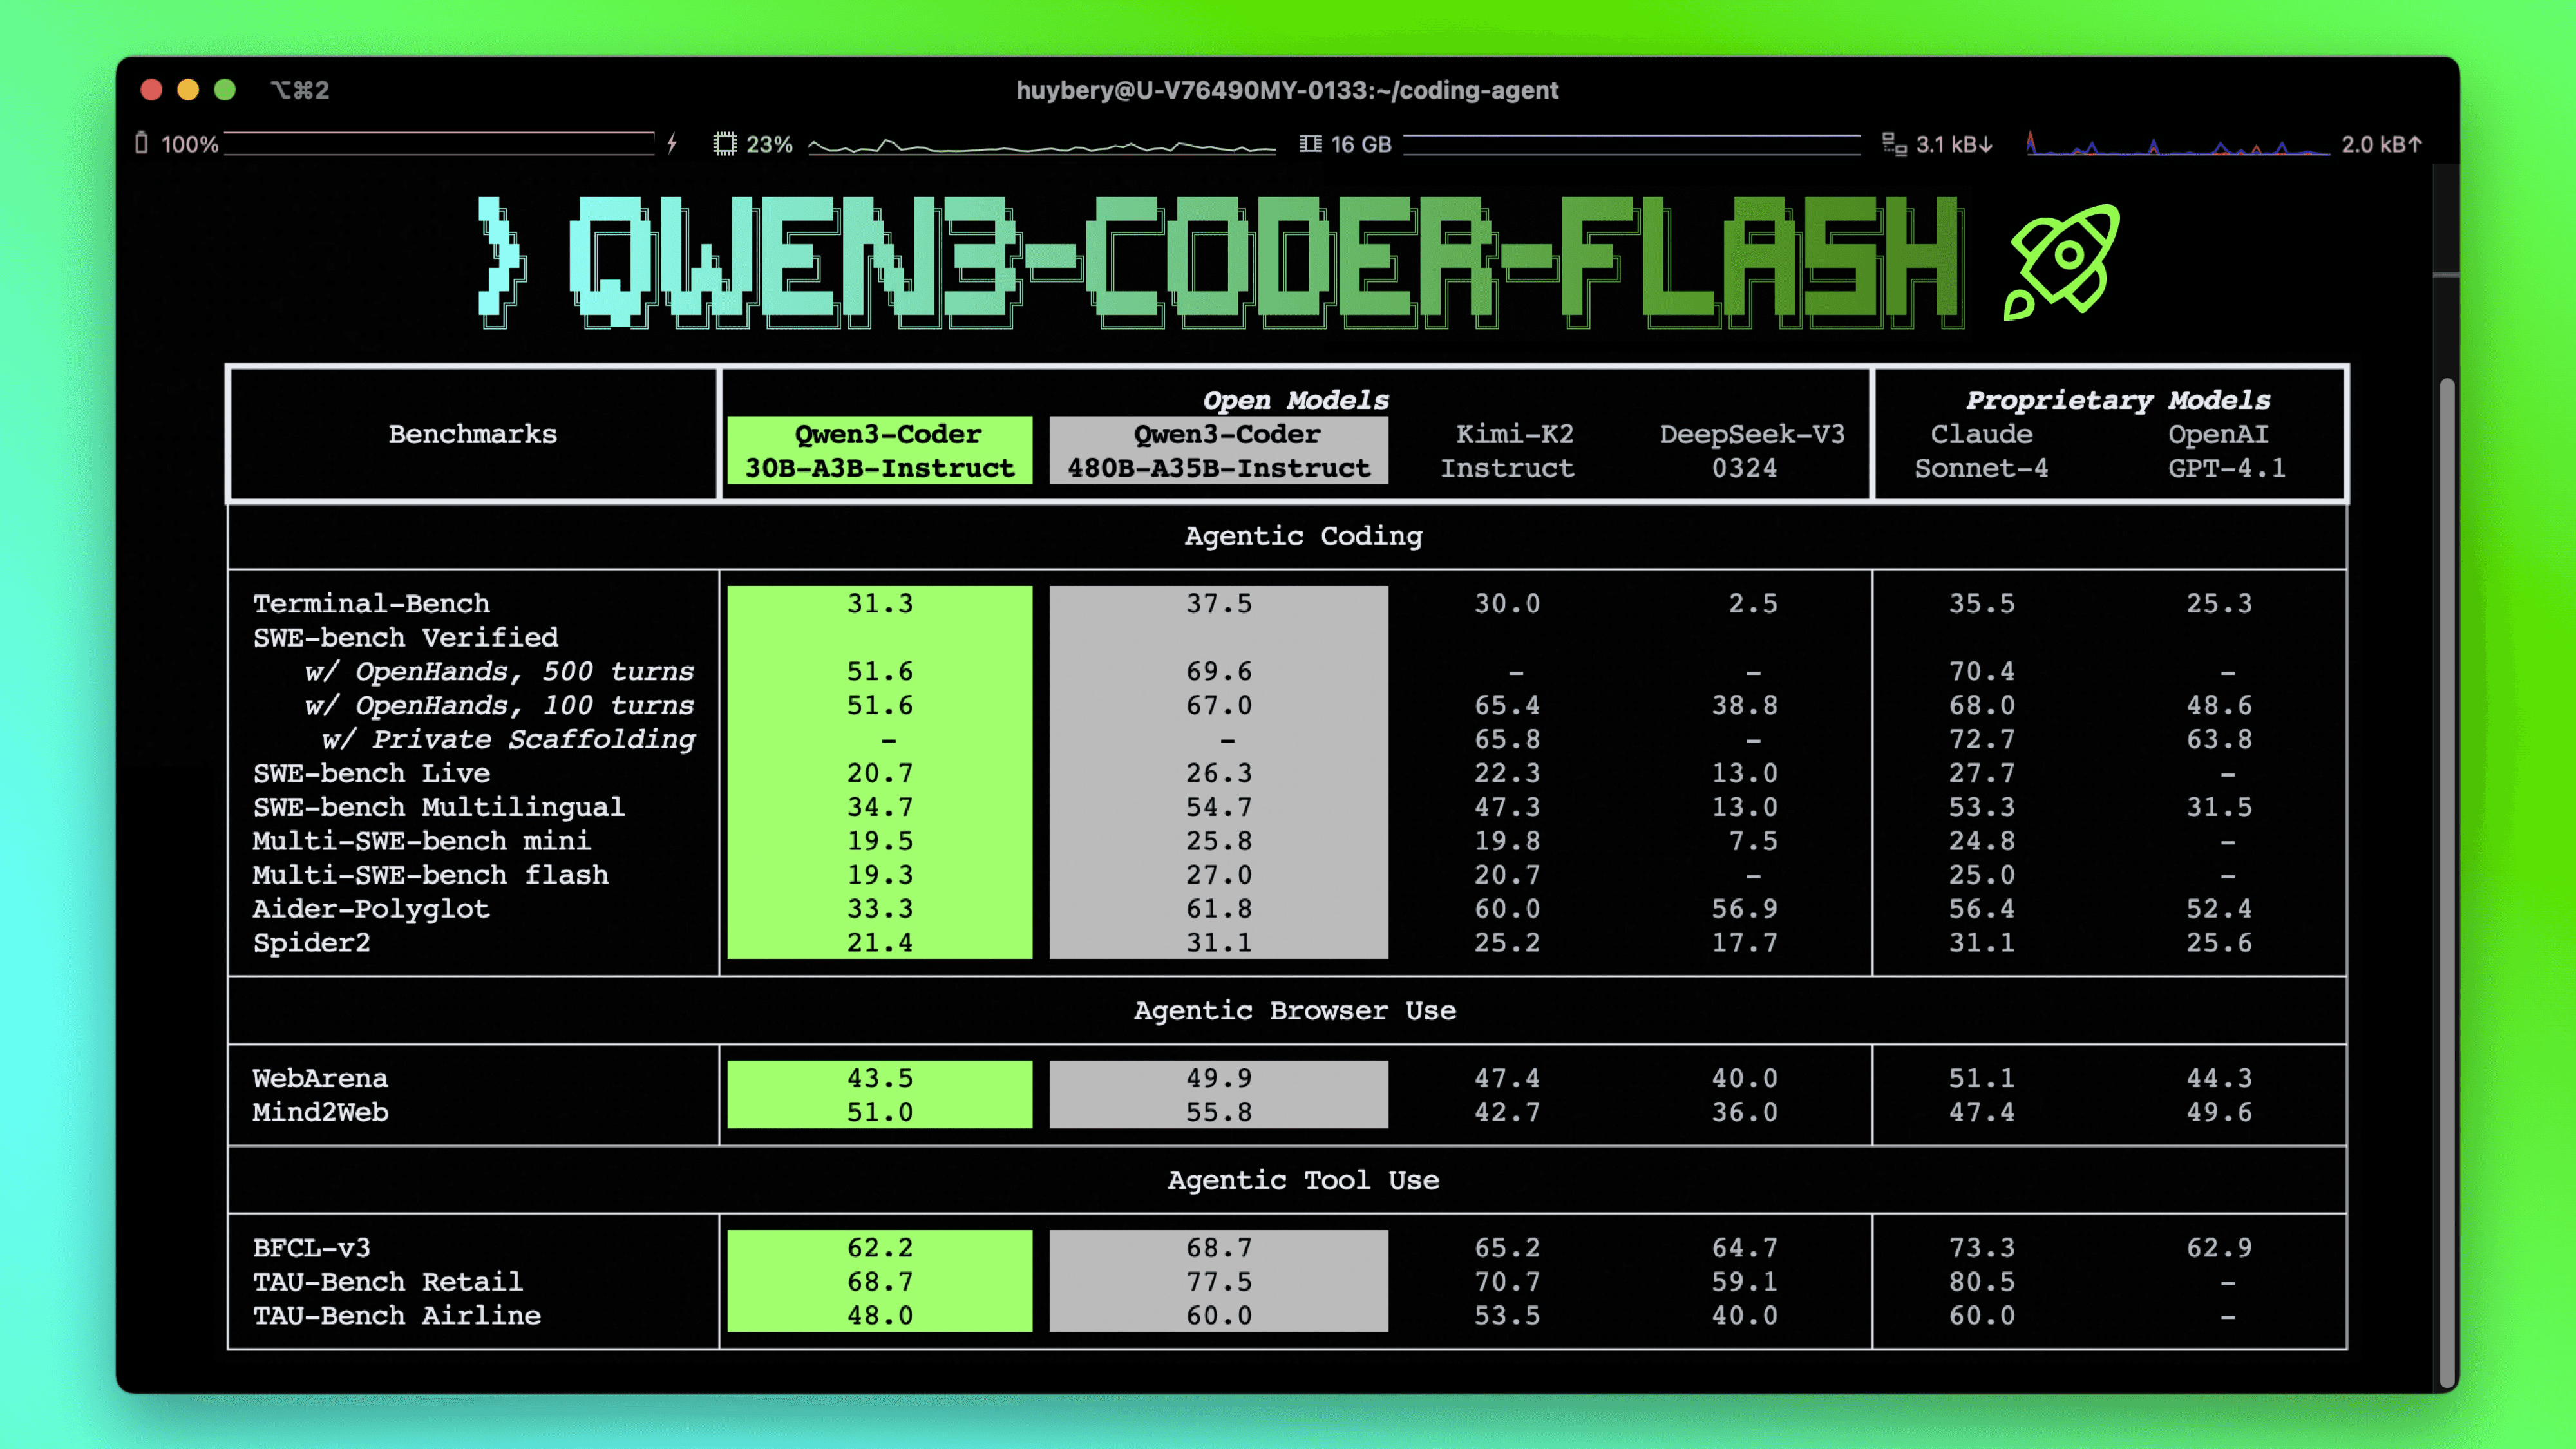
Interestingly, on the Qwen3-Coder-Flash model page, Qwen reports 51.6% on SWE-bench Verified using OpenHands, the same agent framework I am using.
There is also active community discussion about reproducibility for these numbers here. I have not yet found detailed methodology documentation for Qwen3.5's SWE-bench Verified evaluation setup, which may explain part of the discrepancy.
Next Steps / Questions
- Run Qwen3.5-35B-A3B in non-thinking mode.
- Test other Qwen3.5 models.
- Test non-Qwen models.
- Why does BF16 perform worse than the original checkpoint?
- Switch from time-based timeouts (the default in Harbor) to iteration-based limits.
This post contains a broken experiment in which thinking was inadvertently enabled but did not use sampling parameters intended for thinking. See here for a corrected version.
In Part 1 and Part 2, I reported some peculiar behavior for quantized Qwen3.5-2B models:
- KL divergence did not reliably predict downstream coding-agent performance.
- Some quantizations outperformed the original model, while others underperformed.
This post shares early results for a larger variant: Qwen3.5-35B-A3B.
Key Takeaways
vllmcurrently leads this sweep at 46.0% resolved.- Q8_0 and Q5_K_M both outperform the GGUF BF16 variant in resolved rate.
- BF16 and
vllmshow many more timeouts than the quantized GGUF variants. - Public benchmark numbers for this model are meaningfully higher than what I observe locally.
Sweep Summary
| Run | Resolved | % | PPL | KL | Runtime | Exceptions |
|---|---|---|---|---|---|---|
| BF16 | 181/500 | 36.2% | 6.62 | — | 2103m 41s | Timeout(275), ExitCode(17), Reward(3), Verifier(1) |
| Q5_K_M | 194/500 | 38.8% | 6.62 | 0.0083 | 531m 46s | Timeout(8), ExitCode(23), Reward(3), Verifier(1) |
| Q8_0 | 202/500 | 40.4% | 6.61 | 0.0068 | 575m 45s | Timeout(11), ExitCode(24), Reward(1), Verifier(1) |
| vllm | 230/500 | 46.0% | — | — | 1634m 13s | Timeout(145), ExitCode(22), Reward(6) |
Observations
Timeout behavior is a major differentiator
BF16 and vllm both have substantial timeout counts. At this point, it is unclear whether these are true long-horizon failures or loop-like behaviors similar to what I saw with weaker Qwen3.5-2B quantizations. Either way, timeout behavior appears to be a key driver of aggregate score differences.
Behavior differs from Qwen3.5-2B
With Qwen3.5-2B, the smaller GGUF quantizations (Q5_K_M, Q8_0) outperformed both GGUF BF16 and the vllm model. Qwen3.5-35B-A3B shows a similar pattern, but the vllm model outperforms all the GGUF variants.
GGUF BF16 vs original checkpoint is still surprising
There is a notable gap between GGUF BF16 results and the original model results. That is surprising because the original checkpoint is mostly BF16 with a small number of F32 tensors. I checked the GGUF contents and confirmed F32 tensors are present:
vscode ➜ /workspaces/auto-bench (main) $ gguf-dump /home/vscode/.cache/huggingface/hub/models--unsloth--Qwen3.5-35B-A3B-GGUF/snapshots/bc014a17be43adabd7066b7a86075ff935c6a4e2/BF16/Qwen3.5-35B-A3B-BF16-00002-of-00002.gguf | grep "F32" | head -20
INFO:gguf-dump:* Loading: /home/vscode/.cache/huggingface/hub/models--unsloth--Qwen3.5-35B-A3B-GGUF/snapshots/bc014a17be43adabd7066b7a86075ff935c6a4e2/BF16/Qwen3.5-35B-A3B-BF16-00002-of-00002.gguf
    142:       2048 |  2048,     1,     1,     1 | F32     | blk.0.attn_norm.weight
    143:         32 |    32,     1,     1,     1 | F32     | blk.0.ssm_a
    144:      32768 |     4,  8192,     1,     1 | F32     | blk.0.ssm_conv1d.weight
    145:         32 |    32,     1,     1,     1 | F32     | blk.0.ssm_dt.bias
    148:        128 |   128,     1,     1,     1 | F32     | blk.0.ssm_norm.weight
    149:     524288 |  2048,   256,     1,     1 | F32     | blk.0.ffn_gate_inp.weight
    153:       2048 |  2048,     1,     1,     1 | F32     | blk.0.ffn_gate_inp_shexp.weight
    154:       2048 |  2048,     1,     1,     1 | F32     | blk.0.post_attention_norm.weight
    155:       2048 |  2048,     1,     1,     1 | F32     | blk.1.attn_norm.weight
    156:         32 |    32,     1,     1,     1 | F32     | blk.1.ssm_a
    157:      32768 |     4,  8192,     1,     1 | F32     | blk.1.ssm_conv1d.weight
    158:         32 |    32,     1,     1,     1 | F32     | blk.1.ssm_dt.bias
    161:        128 |   128,     1,     1,     1 | F32     | blk.1.ssm_norm.weight
    162:     524288 |  2048,   256,     1,     1 | F32     | blk.1.ffn_gate_inp.weight
    166:       2048 |  2048,     1,     1,     1 | F32     | blk.1.ffn_gate_inp_shexp.weight
    167:       2048 |  2048,     1,     1,     1 | F32     | blk.1.post_attention_norm.weight
    168:       2048 |  2048,     1,     1,     1 | F32     | blk.10.attn_norm.weight
    169:         32 |    32,     1,     1,     1 | F32     | blk.10.ssm_a
    170:      32768 |     4,  8192,     1,     1 | F32     | blk.10.ssm_conv1d.weight
    171:         32 |    32,     1,     1,     1 | F32     | blk.10.ssm_dt.bias
In fact, some tensors appear upcast to F32 in the GGUF file, so raw dtype alone does not explain the performance gap.
Vendor-reported benchmark numbers are much higher
According to Qwen's benchmark page, Qwen3.5-35B-A3B achieves 69.2% on SWE-bench Verified. That is substantially higher than the 46.0% best result in this sweep.
Interestingly, on the Qwen3-Coder-Flash model page, Qwen reports 51.6% on SWE-bench Verified using OpenHands, the same agent framework I am using.
There is also active community discussion about reproducibility for these numbers here. I have not yet found detailed methodology documentation for Qwen3.5's SWE-bench Verified evaluation setup, which may explain part of the discrepancy.
Next Steps
I think the critical question right now is whether the timeouts are legitimate. After reviewing the logs, I think that they may not be. So I'm going to re-run with fewer agents in parallel.
In Part 1, I introduced auto-bench, a tool for benchmarking quantized LLMs for local coding agents, and shared some results from a preliminary study on a single instance from SWE-bench Verified. The results showed that (1) KL Divergence doesn't predict performance, and (2) quantizations can both outperform and underperform the original model.
In this post, I'll share some new results. Like the other experiment, this one
also focuses on Qwen3.5-2B. Unlike the other experiment, which tested a
single instance of SWE-bench Verified with eight
attempts,
this experiment tests all instances of SWE-bench Verified with one
attempt.
Results
Without further ado, here are the results.
| Quant | Resolved | % | PPL | KL | Runtime | Exceptions |
|---|---|---|---|---|---|---|
| BF16 | 28/500 | 5.6% | 13.38 | — | 547m 59s | Timeout(47), ExitCode(22), Verifier(2) |
| IQ4_NL | 26/500 | 5.2% | 13.67 | 0.0309 | 423m 21s | Timeout(29), ExitCode(16), Verifier(1) |
| IQ4_XS | 24/500 | 4.8% | 13.68 | 0.0318 | 493m 7s | Timeout(39), ExitCode(15), Reward(1), Verifier(2) |
| Q3_K_M | 30/500 | 6.0% | 14.33 | 0.0774 | 785m 43s | Timeout(67), ExitCode(21) |
| Q3_K_S | 20/500 | 4.0% | 15.08 | 0.1334 | 742m 25s | Timeout(73), ExitCode(25), Reward(1), Verifier(1) |
| Q4_0 | 24/500 | 4.8% | 13.91 | 0.0454 | 407m 34s | Timeout(25), ExitCode(21), Verifier(1) |
| Q4_1 | 36/500 | 7.2% | 13.68 | 0.0273 | 766m 19s | Timeout(59), ExitCode(16), Reward(1), Verifier(1) |
| Q4_K_M | 27/500 | 5.4% | 13.79 | 0.0230 | 357m 0s | Timeout(20), ExitCode(23), Verifier(2) |
| Q4_K_S | 19/500 | 3.8% | 13.78 | 0.0274 | 519m 39s | Timeout(38), ExitCode(23), Reward(1), Verifier(1) |
| Q5_K_M | 62/500 | 12.4% | 13.46 | 0.0082 | 784m 58s | Timeout(61), ExitCode(23), Reward(1), Verifier(1) |
| Q5_K_S | 46/500 | 9.2% | 13.49 | 0.0100 | 563m 27s | Timeout(30), ExitCode(25), Reward(1), Verifier(3) |
| Q6_K | 58/500 | 11.6% | 13.48 | 0.0035 | 820m 37s | Timeout(62), ExitCode(20), Verifier(1) |
| Q8_0 | 37/500 | 7.4% | 13.39 | 0.0012 | 598m 13s | Timeout(46), ExitCode(17), Verifier(1) |
| UD-IQ2_M | 1/500 | 0.2% | 17.61 | 0.2677 | 1866m 13s | Timeout(300), ExitCode(24), Verifier(1) |
| UD-IQ2_XXS | 1/500 | 0.2% | 27.11 | 0.7018 | 2196m 49s | Timeout(371), ExitCode(19) |
| UD-IQ3_XXS | 5/500 | 1.0% | 15.31 | 0.1549 | 1481m 24s | Timeout(230), ExitCode(24), Verifier(1) |
| UD-Q2_K_XL | 2/500 | 0.4% | 17.15 | 0.2388 | 442m 51s | Timeout(29), ExitCode(27) |
| UD-Q3_K_XL | 48/500 | 9.6% | 13.94 | 0.0520 | 738m 44s | Timeout(57), ExitCode(19), Reward(1), Verifier(1) |
| UD-Q4_K_XL | 57/500 | 11.4% | 13.60 | 0.0164 | 759m 13s | Timeout(48), ExitCode(18), Reward(2), Verifier(2) |
| UD-Q5_K_XL | 62/500 | 12.4% | 13.51 | 0.0077 | 932m 37s | Timeout(71), ExitCode(18), Reward(2), Verifier(1) |
| UD-Q6_K_XL | 29/500 | 5.8% | 13.48 | 0.0020 | 539m 38s | Timeout(35), ExitCode(20), Verifier(1) |
| UD-Q8_K_XL | 36/500 | 7.2% | 13.37 | 0.0011 | 502m 1s | Setup(1), Timeout(35), ExitCode(23), Verifier(2) |
| vllm | 26/500 | 5.2% | — | — | 521m 14s | Timeout(49), ExitCode(11), Verifier(1) |
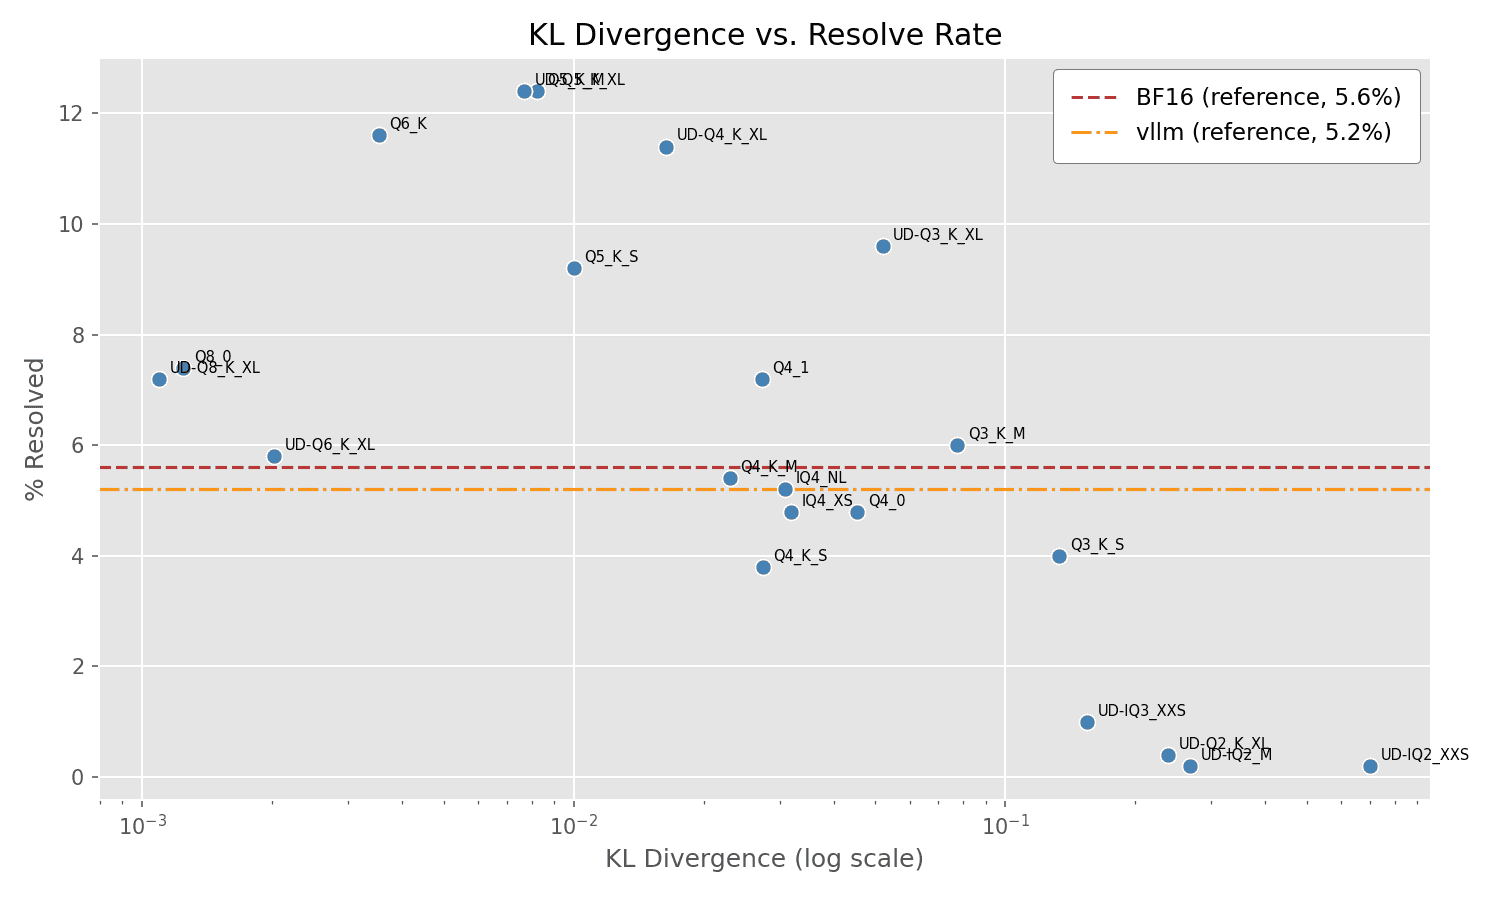
And the plot of % Resolved vs KL Divergence:
Observations
A few observations:
- The overall resolve rates are low across the board. This is not a very powerful model. I intentionally selected an easy problem instance for the Part 1 experiment.
- As in Part 1, many of the "mid-range" quantizations outperform the original model, yet small and large quantizations underperform. This is consistent with the idea that some quantizations are actually beneficial, while others are harmful.
- Also as in Part 1, KL Divergence does not fully explain performance.
What next?
This experiment largely confirmed the findings from Part 1 about the Qwen3.5-2B model. An open question is whether these results apply to other models as well. I plan to run similar experiments on larger variants of the Qwen3.5 family next, but I won't be evaluating every quantization. Too much time is wasted on bad quantizations because they get stuck in endless loops. Instead, I'll probably try a select few quantizations, such as BF16, Q8_0, and Q5_K_M. Although I am interested in understanding these peculiar behaviors, my primary goal is actually to find which models and quantizations are usable.
New open LLMs are released constantly and keep improving. Gemma 4 was recently claimed to be groundbreaking, but when I tried the quantized version for coding agents like opencode, it was completely unusable—it gets stuck in output loops or unable to call tools with correct syntax. This is the norm, not an exception. Most quantized open LLMs I try for agentic AI simply don't work. Finding a setup that does requires trial and error across model, quantization, and dozens of settings.
I just want a command I can run to get a working LLM for my GPU. No hours of experimentation. No guessing at combinations. Just a proven setup. I couldn't find one, so I built auto-bench.
auto-bench
Auto-bench is a tool that allows you to define experiments, automatically run LLM inference servers with the proper settings, and execute a set of benchmarks against them. Rather than reinventing the wheel, I'm currently using Harbor Framework to run the tests. Auto-bench has first-class support for quantized models. This is important, because most existing benchmarks and leaderboards don't consider quantization, even though that is how many people run models.
My project is in its earliest stages, but I have at least one experiment to share: testing various quantizations of the Qwen3.5-2B model on a single problem instance from SWE-bench Verified (swe-bench/sympy__sympy-22914). I deliberately selected an easy instance to see if quantized models can perform basic tool calls to solve an easy problem.
Here is how this experiment is configured in auto-bench:
# Benchmark 22 quants of Qwen3.5-2B on a single SWE-bench instance
# Usage: auto-bench run configs/qwen-2b-quant-sweep.yaml

name: qwen-2b-quant-sweep
backend_type: llamacpp
dataset: SWE-bench/SWE-bench_Verified

instance_ids:
  - swe-bench/sympy__sympy-22914

model:
  name: Qwen3.5-2B
  source: huggingface
  repo_id: unsloth/Qwen3.5-2B-GGUF
  sweep:
    - label: BF16
      filename: Qwen3.5-2B-BF16.gguf
    - label: Q3_K_S
      filename: Qwen3.5-2B-Q3_K_S.gguf
    - label: Q5_K_M
      filename: Qwen3.5-2B-Q5_K_M.gguf
    - label: Q5_K_S
      filename: Qwen3.5-2B-Q5_K_S.gguf
    - label: Q6_K
      filename: Qwen3.5-2B-Q6_K.gguf
    # ... 17 more quantizations

sampling:
  temperature: 0.7
  top_p: 0.8
  top_k: 20
  min_p: 0.0
  presence_penalty: 1.5
  repetition_penalty: 1.0
agent:
  agent: openhands
  env: docker
  attempts: 4
  limit: 1
  setup_multiplier: 10.0

evaluation:
  run_evaluation: true
Part of my goal is to include all information needed to actually run the models properly. For example, the sampling section includes the sampling parameters that are recommended by Qwen for best performance, and these types of details can make a huge effect! My vision is to eventually have a leaderboard that will provide you with a llama.cpp command-line to run the model with the proper settings, and then you can just copy and paste that command to get a working LLM for your coding agent.
Results
Before diving into the data, here's what the columns mean:
- Resolved: Number of problem instances successfully resolved by the agent
- Total: Total number of attempts (8 in this case)
- % Resolved: Resolution rate as a percentage
- PPL (Perplexity): Measures the model's confidence in its predictions. Lower is generally better, though surprisingly this doesn't always correlate with task success
- KL: Kullback-Leibler divergence—how much the quantized model's output distribution diverges from the original model's. Lower is better, but as we'll see, it's not a strong predictor of task performance
- Runtime: Total time to run all attempts
- Exceptions: Types of errors encountered (e.g., timeouts, exit code errors)
| Quant | Resolved | % | PPL | KL | Runtime | Exceptions |
|---|---|---|---|---|---|---|
| BF16 | 0/8 | 0% | 13.38 | — | 3m 37s | — |
| IQ4_NL | 1/8 | 12.5% | 13.67 | 0.0309 | 3m 53s | — |
| IQ4_XS | 0/8 | 0% | 13.68 | 0.0318 | 51m 53s | Timeout, ExitCode |
| Q3_K_M | 2/8 | 25% | 14.33 | 0.0774 | 51m 48s | Timeout |
| Q3_K_S | 5/8 | 62.5% | 15.08 | 0.1334 | 51m 39s | Timeout |
| Q4_0 | 4/8 | 50% | 13.91 | 0.0454 | 19m 5s | — |
| Q4_1 | 3/8 | 37.5% | 13.68 | 0.0273 | 11m 14s | — |
| Q4_K_M | 1/8 | 12.5% | 13.79 | 0.0230 | 4m 8s | ExitCode |
| Q4_K_S | 2/8 | 25% | 13.78 | 0.0274 | 4m 43s | — |
| Q5_K_M | 8/8 | 100% | 13.46 | 0.0082 | 51m 48s | Timeout |
| Q5_K_S | 6/8 | 75% | 13.49 | 0.0100 | 8m 53s | — |
| Q6_K | 7/8 | 87.5% | 13.48 | 0.0035 | 51m 54s | Timeout |
| Q8_0 | 4/8 | 50% | 13.39 | 0.0012 | 51m 49s | Timeout |
| UD-IQ2_M | 0/8 | 0% | 17.61 | 0.2677 | 51m 56s | Timeout(5) |
| UD-IQ2_XXS | 0/8 | 0% | 27.11 | 0.7018 | 51m 58s | Timeout(6), ExitCode |
| UD-IQ3_XXS | 0/8 | 0% | 15.31 | 0.1549 | 51m 49s | Timeout |
| UD-Q2_K_XL | 0/8 | 0% | 17.15 | 0.2388 | 51m 49s | Timeout(2) |
| UD-Q3_K_XL | 6/8 | 75% | 13.94 | 0.0520 | 51m 56s | Timeout(2) |
| UD-Q4_K_XL | 6/8 | 75% | 13.60 | 0.0164 | 7m 40s | — |
| UD-Q5_K_XL | 8/8 | 100% | 13.51 | 0.0077 | 18m 2s | — |
| UD-Q6_K_XL | 3/8 | 37.5% | 13.48 | 0.0020 | 6m 51s | — |
| UD-Q8_K_XL | 3/8 | 37.5% | 13.37 | 0.0011 | 5m 49s | — |
| vllm | 1/8 | 12.5% | — | — | 6m 32s | — |
The Base Model Is Broken
The most striking finding is that the unquantized base model (shown as vllm in the results) achieves only 12.5% resolution—worse than most quantized versions. BF16, which is nearly the original model without quantization, also consistently fails at 0%. This suggests the base model is fundamentally broken for this coding task, but quantization somehow fixes it.
Many medium-sized quantizations (Q5_K_M, UD-Q5_K_XL, Q6_K) achieve 100%, 100%, and 87.5% resolution respectively. Yet larger quantizations like Q8_0 fail again at 50%. This isn't about bigger being better—it's about finding the quantization that repairs the base model's broken reasoning.
KL Divergence Doesn't Predict Success
The KL (Kullback-Leibler) divergence column measures how much a quantized model's output distribution diverges from the original. If the base model is broken for this task, then staying close to the original (low divergence) just means inheriting the same brokenness. That could explain why there's no strong correlation between divergence and success.
Q5_K_M achieves 100% resolution with low divergence (0.0082)—but so does UD-Q5_K_XL with similar low divergence. Meanwhile, BF16 (essentially 0 divergence, nearly the original) fails completely at 0%. Some high-divergence models like UD-IQ2_XXS fail too, but others like Q3_K_S achieve 62.5% with divergence of 0.1334.
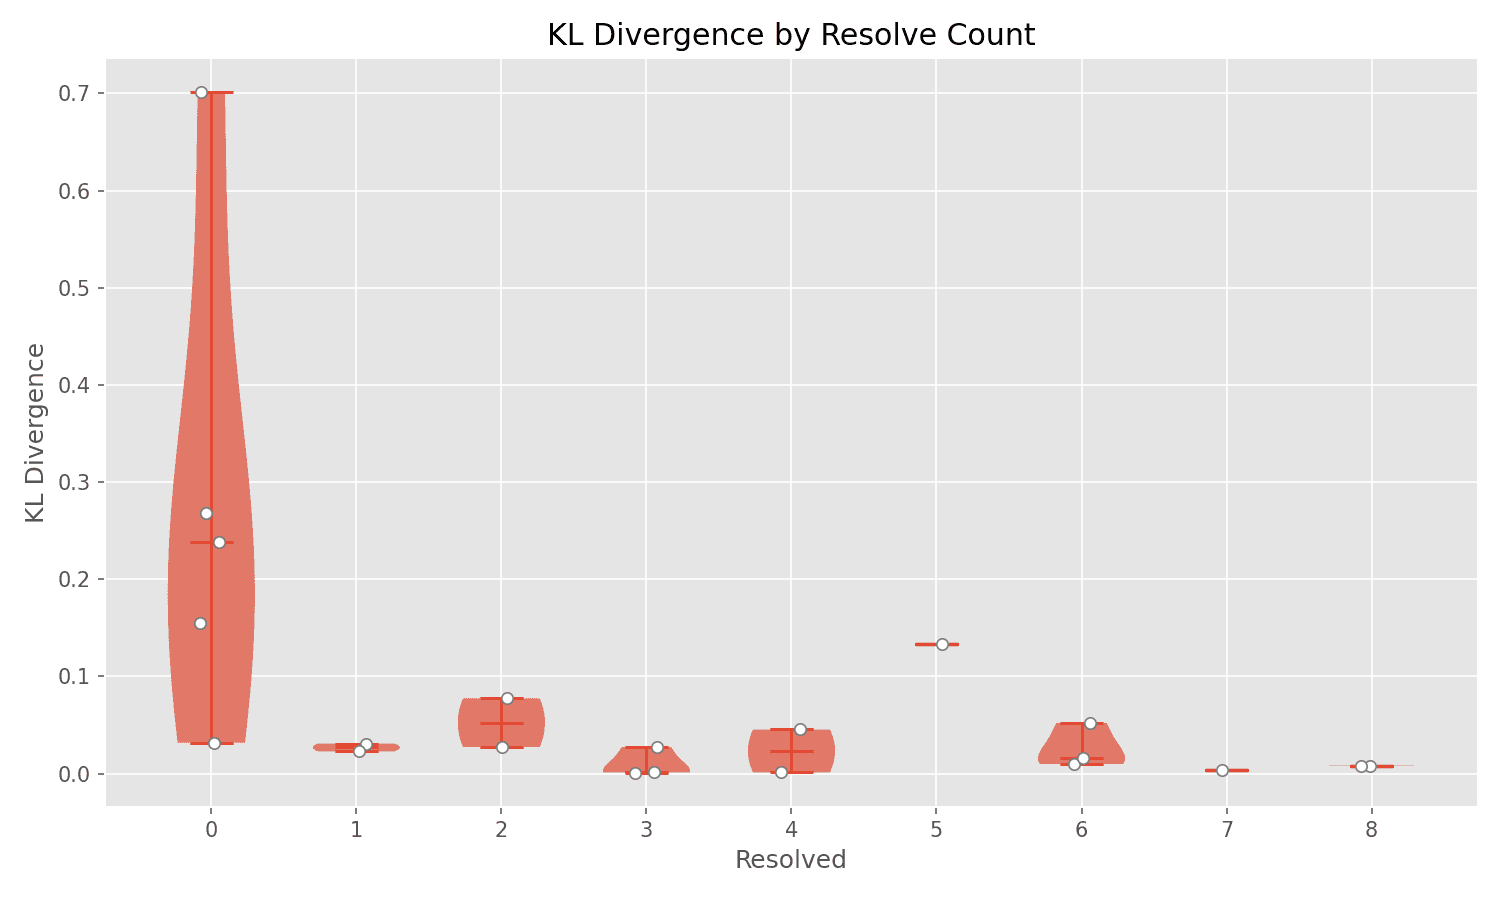
The plot tells the story: failing models (0 resolved) scatter across the entire divergence range—some very close to the original, some far away. If you stayed loyal to a broken base model, you'd fail. If you accidentally diverged in the right way, you'd succeed. KL divergence alone can't tell you which happened.
Multiple Failure Modes
There are two distinct failure modes visible in the results.
Failure Mode 1: Infinite Loops (AgentTimeoutError)
Many quantizations exhibit infinite looping behavior, where the agent gets stuck generating the same outputs repeatedly and eventually hits the timeout limit. Models like UD-IQ2_M, UD-IQ2_XXS, IQ4_XS, and IQ3_XXS show multiple AgentTimeoutError instances. Interestingly, this failure mode appears to correlate strongly with extremely aggressive quantization (e.g., IQ2 variants with very high KL divergence > 0.26).
Failure Mode 2: Silent Failure
The second failure mode is when the agent runs to completion without timing out, but simply fails to correctly solve the problem. Models like BF16, UD-IQ2_XXS, and UD-IQ3_XXS never produce output loops, but they still achieve 0% resolution. This suggests that the quantization has degraded the model's reasoning ability below a critical threshold where it can't effectively reason about code, even if it's still syntactically generating valid tool calls.
Conclusion: The Base Model Is Broken, Quantization Fixes It
The core finding is that the unquantized base model (12.5% resolution) and near-original BF16 (0% resolution) both fail for this coding task. Yet specific quantizations like Q5_K_M and UD-Q5_K_XL achieve 100%. Quantization isn't degrading a working model—it's repairing a broken one.
Notice in the visualization: models that fail (0 resolved) scatter across the entire KL divergence range, from very close to the original all the way to extremely divergent. Models that succeed tend to cluster at low divergence. But the scatter on the left side proves you can't predict failure from divergence—some quantizations stay very close to the original yet still fail.
The lesson is that model quality for coding agents is challenging to predict. This is why auto-bench exists—to empirically measure what actually works for your specific use case.
Open Questions and Limitations
This experiment demonstrates an interesting phenomenon, but it's based on a single problem instance from a single model family. The findings should be interpreted with appropriate caution:
- Generalization to other models: Do these patterns hold for Llama, Mistral, or other model families? The behaviors might be Qwen-specific.
- Generalization to other instances: I deliberately chose an easy instance to see if quantized models could work at all. Would the patterns hold on harder instances? SWE-bench Verified spans easy to extremely difficult problems.
- Generalization to other tasks: Would we see similar results on SWE-bench instances beyond Verified, or on other benchmarks like HumanEval or MBPP?
- Sampling parameter sensitivity: How much of the improvement from quantized models comes from properly-tuned sampling parameters? A controlled ablation would be valuable.
I'm actively running experiments to answer these questions! The auto-bench framework is designed to scale to hundreds of model/quantization combinations and thousands of problem instances. Stay tuned for results on larger model families, more problem instances, and more task types.
Powered with by Gatsby 5.0